We thank Crowley et al. for their extensive comments on our recent paper. As a general comment, we would emphasize that in the publication of a document the size and scope of the BEIR VII report, it is not sufficient to bury important statements on the acknowledged limitations of the methodology deep within the document. There are significant limitations on any estimate of radiation risk (which the BEIR VII committee does acknowledge in various parts of the report) but never mentions in either the public or executive summary. More importantly, tables such as those contained in Annex 12D, which are widely used and quoted in many studies, contain no caveats or warnings about the significant uncertainty and limitations of the data therein. Many investigators, who are not expert in this field, assume these calculations are based on solid scientific data rather than on hypothesis and extrapolation.
Response to Section on LNT Model and BEIR: Historical Foundations
While the reviewers state that “future BEIR committees …will not be bound by previous BEIR reports”, the obvious tendency is to build on previous reports. For example, the BEIR VI report (1) states “The committee's models are a direct extension of the BEIR IV model, which included parameters for time since exposure and attained age, but not exposure rate or exposure duration, as in the BEIR VI models”. We don't fault the BEIR committees for doing so as it is logical to build on the knowledge base from previous reports. It does, however, make it very difficult to break from the mold and dispassionately review alternative models.
Response to Section on Environmental Studies
We acknowledge that at moderate to high doses, the LNT model provides a sound estimate of cancer risk. However at low doses we believe that this model fails to explain the findings in many well-designed animal and clinical studies. Crowley et al. claim that we failed to look at many studies that support the LNT theory. To this we would like to make 2 points. 1. The responders are defending a theory – the LNT. If the LNT is correct, then it should be able to explain the findings in all studies and not ones that are preferred by Crowley et al. As the group claiming that the LNT is unable to explain the findings at low doses, we have the luxury of picking any study we like (provided the science is sound) and determining if the findings are consistent with the LNT. If the findings are not consistent with LNT, and there are no apparent confounding factors, then there is a problem with the theory. 2. We know that the LNT works well at high doses (>100 mSv), but seems to be unable to adequately explain all the findings when applied to doses below this threshold. This is analogous to Newtonian mechanics and Quantum mechanics. Newtonian mechanics works well at the macroscopic level but cannot explain behavior at the atomic level. Likewise, we contend that LNT can explain the behavior of ionizing radiation at high doses, but fails to adequately explain the findings at low doses. Unlike other areas of physics or science, when a theory fails to explain the scientific data, the theory is revised and updated. For some reason, that usual pattern is not followed in radiation research.
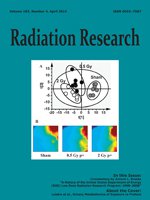
The chair of the BEIR VII committee was emphatic in his support for the LNT, with the press report going as far as recommending that people live on the upper floors of buildings to reduce their radon exposure. We find it hard to accept a recommendation that is so at odds with the natural history of lung cancer. Crowley et al. claim that we failed to look at larger studies – so let's look at this a different way. Figure 1a is a graph of the lung cancer by county in the U.S. taken from the latest National Cancer Institute cancer mortality map (2). Figure 1b is the graph of the radon level by county in the U.S. taken from the EPA web site (3). Although there is no correction for potential confounding factors such as smoking, when averaged over the entire U.S. population one would expect that these confounding factors would be relatively constant throughout the country. So we would anticipate a positive correlation between lung cancer and radon levels. Instead there is a clear INVERSE correlation. It is difficult to conceive how this relationship could be converted into a positive correlation between radon level and lung cancer. Could there be confounding factors that could convert an inverse correlation to a positive correlation – we doubt it. Note, as one would expect, no other cancer listed in the National Cancer Institute database demonstrates an obvious correlation with radon level. We are not the first to point out this effect – this was first pointed out by Cohen in 1995 (4) and has been hotly debated ever since with no clear explanation as to how these findings can be reconciled with the LNT hypothesis (5, 6).
FIG. 1.
Panel a: National Cancer Institute map of lung cancer rates in the U.S. 2000–2004. Panel b: Environmental Protection Agency map of radon zones in the U.S.

FIG. 2.
Unadjusted odds ratio of lung cancer as a function of radon exposure – adapted from Table 9 of Krewski et al. (8) showing summed data from combined analysis of North American case-control studies.

Thompson et al. (7) shows an example of a study that was well performed and yet demonstrated a statistically significant radioprotective effect at low doses of radon. The reviewers criticize us for our use of the Thompson study and ignoring some larger studies. We would point out the excellent review and comparison of the findings in the North American study (8) vs. Thompson (7). The study of Thompson et al. is a far more tightly controlled study than the North American studies reviewed by Krewski et al. (8), which is a meta-analysis of 7 separate studies. We have looked at the Krewski et al. study (8) and would point out that while this shows a positive correlation between radon and lung cancer, the methods used to calculate risk differed significantly between the 2 studies. Thompson allowed their data to drive the functional form of the best fit. The study by Krewski et al. (8) fits only to a form:
where x = radon concentration and B is the excess odds ratio per unit of radon. This is essentially a linear model that follows the LNT. To illustrate this issue we re-plotted the summed odds ratio from all the studies shown in Table 9 found in the Krewski et al. study (8) (see Fig. 2). No model has been fitted to the data and all data points but one were statistically below 1. We remain unconvinced of the validity of the LNT model for estimation of risk from radon exposure in this study, as well as that of the Thompson study.
Occupational Studies
We agree that occupational studies are not suited to the creation of risk models as the data in them cannot be easily categorized in a manner that allows risk estimates to be generated. However no acknowledgment is given that many of these studies (some containing over 500,000 subjects), that fail to show a detrimental effect, are inconsistent with the LNT and should not be dismissed simply because their format does not lend itself to the generation of a risk model. Should these results not give cause for reconsideration of a theory that if applied to this population would give a result that is diametrically opposed from these findings?
The BEIR VII committee noted that rates for all causes and cancer mortality were substantially less than in the general public and explain this as a “healthy worker effect”. This is a convenient way of dismissing all these studies. In response to that criticism, we would point to the Nuclear Shipyard Worker Study of over 70,000 workers that is reviewed by Sponsler and Cameron (9). That study used a high-dose cohort of 27,872 nuclear workers, a low-dose cohort of 10,348 nuclear workers and a control cohort of 32,510 unexposed workers. So the “healthy worker effect” was not applicable to this study. The high-dose cohort (>5 mGy/year) demonstrated significantly lower mortality from malignant neoplasms than the unexposed cohort. The Standardized Mortality Ratio was 1.12 (95% CI: 1.06-1.20) in the control cohort, dropping to 0.95 (95% CI: 0.88–1.03) in the high-dose cohort. These findings are in general agreement with reductions in overall mortality from other studies of workers in nuclear facilities and radiology practices in the U.S., UK, Canada and Australia (10, 11) and cannot be explained by the “healthy worker effect”.
Medical Radiation Studies
Most of the medical radiation studies include patients who received high doses of radiation. The linear model only worked when high doses are incorporated into the data – again, we do not dispute that the LNT works at high doses. By including high-dose data in the fit, one overwhelms what happens at low doses.
Atomic Bomb Survivor Studies
We apologize for inadvertently implying that RERF performed the risk estimates for the BEIR VII committee. We defer to the RERF group's vast experience in how best to fit the LSS cohort, but would again refocus this discussion back to what happens at low dose. We do not disagree with the overall findings of the RERF's work, but when one includes the high-dose data in any analysis, it will tend to drive the overall fit and overwhelm any nonlinear response at low doses. That presupposes a linear or linear-quadratic-type response. We would not be concerned about precisely what quantitative model was used if it were not for the myriad of studies that offer contradictory findings at low doses.
As we discussed in our commentary, if the LNT model was applied to any other toxic compound (e.g. mercury, lead etc.), then in theory we would have vastly more deaths related to these toxic compounds than are observed.
Risk Models
Agreed – we were not strictly correct in stating that all estimates should be within 1–2 standard deviations of each other. We also agree that the ERR estimates from medically exposed populations and atomic bomb survivors are not strictly comparable. However, it can be argued that the medically exposed populations are more representative of the U.S. population than a Japanese population under wartime conditions (physical, emotional stress, starvation, etc.).
We agree there is no reason to expect agreement between ERR and EAR models from Japanese to Western populations when the background rates for a cancer site differ appreciably between the two populations. We are not aware (and it does not appear to be addressed in the BEIR VII report), that the committee made any adjustment in EAR model to convert from a Japanese model to an American model. Indeed, Table 12–5A of the BEIR VII report and the accompanying discussion on page 279 discuss how the committee mixed the risk estimates from the two models without any mention of the impact of underlying disease incidence in the target population.
We would agree that a low value for the DDREF (1 or 1.5) essentially preserves the LNT model, however higher values for DDREF (in the range 2–10) and application of the DDREF at a threshold such as 100 mSv would essentially convert the LNT into a threshold model.
Science and Politics
As scientists we are acutely aware of the credibility of radiation science in the policy and public domains. We also have to deal on a daily basis with the consequences of reports such as BEIR VII. One of us (MKOC) became involved in estimating radiation-induced mortality from medical procedures because of published articles purporting to show high numbers of cancers due to medical imaging. Like many other medical imaging scientists, MKOC utilized tables in Annex 12 of BEIR VII to generate similar estimates (12). It was only with further reading and closer examination of the report that revealed the numerous hypotheses, assumptions and subjective decisions that were used to generate the final risk estimates.
We place considerable responsibility for the public fear of low doses of ionizing radiation to numerous reports that have, in our opinion, inappropriately used the BEIR VII report to generate inflammatory assessments that misrepresent the health consequences of medical radiation. This has led to many scientific bodies such as UNSCEAR, AAPM, and HPS issuing statements against the use of risk estimates at radiation levels at or below natural background levels (13). We maintain that the BEIR VII committee failed to adequately stress the limitations, assumptions and subjective opinions that went into their risk estimates.