Open Access
How to translate text using browser tools
2 January 2014 Bird–building collisions in the United States: Estimates of annual mortality and species vulnerability
Scott R. Loss, Tom Will, Sara S. Loss, Peter P. Marra
Author Affiliations +
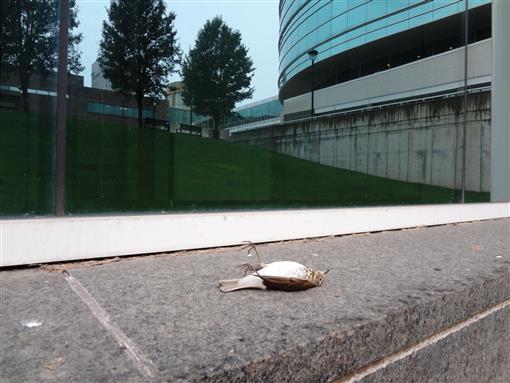
FIGURE 1.
A Swainson's Thrush killed by colliding with the window of a low-rise office building on the Cleveland State University campus in downtown Cleveland, Ohio. Photo credit: Scott Loss

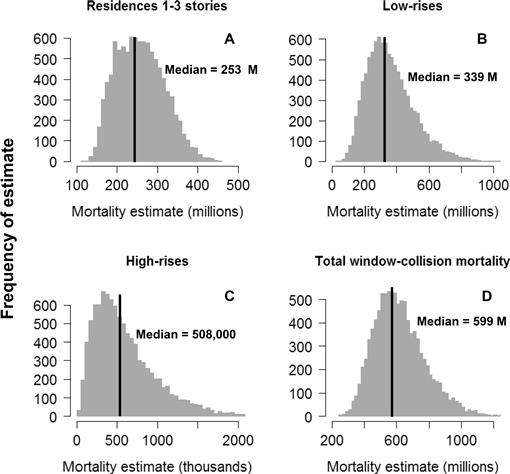
FIGURE 2.
Frequency histograms for estimates of annual U.S. bird mortality caused by collisions with (A) residences 1–3 stories tall, (B) low-rises (residences 4–11 stories tall and all non-residential buildings ≤11 stories tall), (C) high-rises (all buildings ≥12 stories tall), and (D) all buildings. Estimates for low-rises and for all buildings are based on the average of two estimates: one calculated with all eight low-rise studies meeting inclusion criteria and one calculated with a subset of four low-rise studies that conducted year-round sampling.

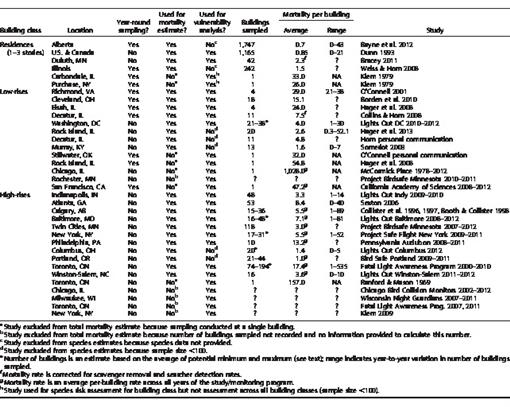
TABLE 1.
Sampling coverage, number of buildings sampled, and mortality rates documented in studies meeting inclusion criteria for estimation of total annual U.S. mortality from bird–building collisions and/or calculation of species-specific collision vulnerability.

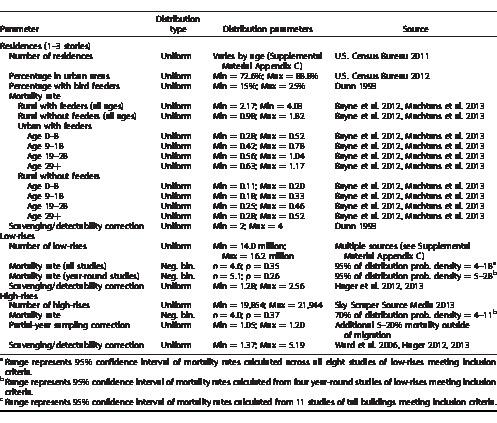
TABLE 2.
Probability distributions used to estimate total annual U.S. mortality from bird–building collisions. We defined uniform distributions for most parameters because not enough data exist to ascribe higher probability to particular values in the defined range. We defined negative binomial distributions for the low-rise and high-rise mortality rate distributions because they allowed the majority of probability density to match the confidence intervals indicated by the data while also allowing for a small probability of higher collision mortality rates, reflecting the exceptionally high mortality rates that have been documented at some low-rises and high-rises (see mortality rates in Table 1).

TABLE 3.
Estimates of annual bird mortality caused by building collisions at U.S buildings. For low-rises (and therefore, for the total mortality estimate), we generated two separate estimates of collision mortality, one using mortality rates based on all eight low-rise studies meeting our inclusion criteria and one based on a subset of four low-rise studies that sampled mortality year-round.

TABLE 4.
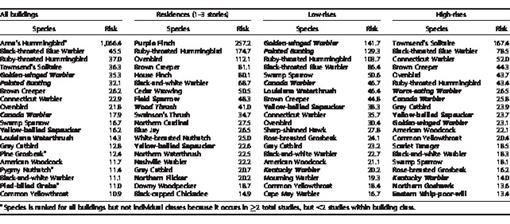
Estimates of species vulnerability to building collisions. Risk values indicate the factor by which species are at a greater risk of collision compared with a species with average risk. Species in boldface italics are Birds of Conservation Concern at the national level and species in boldface are Birds of Conservation Concern in at least one U.S. region (U.S. Fish and Wildlife Service 2008). Scientific names are in Supplemental Material Appendix D.

TABLE 5.
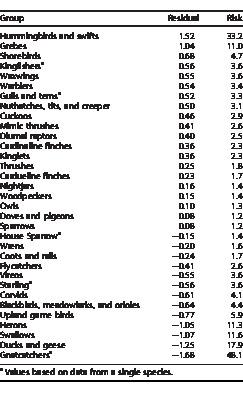
Average vulnerability of bird groups to building collisions across all building types. Risk values indicate the factor by which a species has a greater chance (for positive residuals) or a smaller chance (for negative residuals) of mortality compared with a species with average risk.

KEYWORDS
anthropogenic mortality
Birds of Conservation Concern
high-rise
individual residence
low-rise
systematic review
window collision
Back to Top