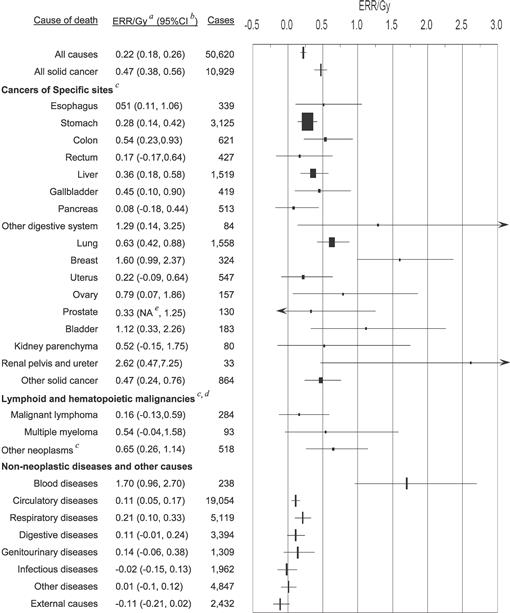
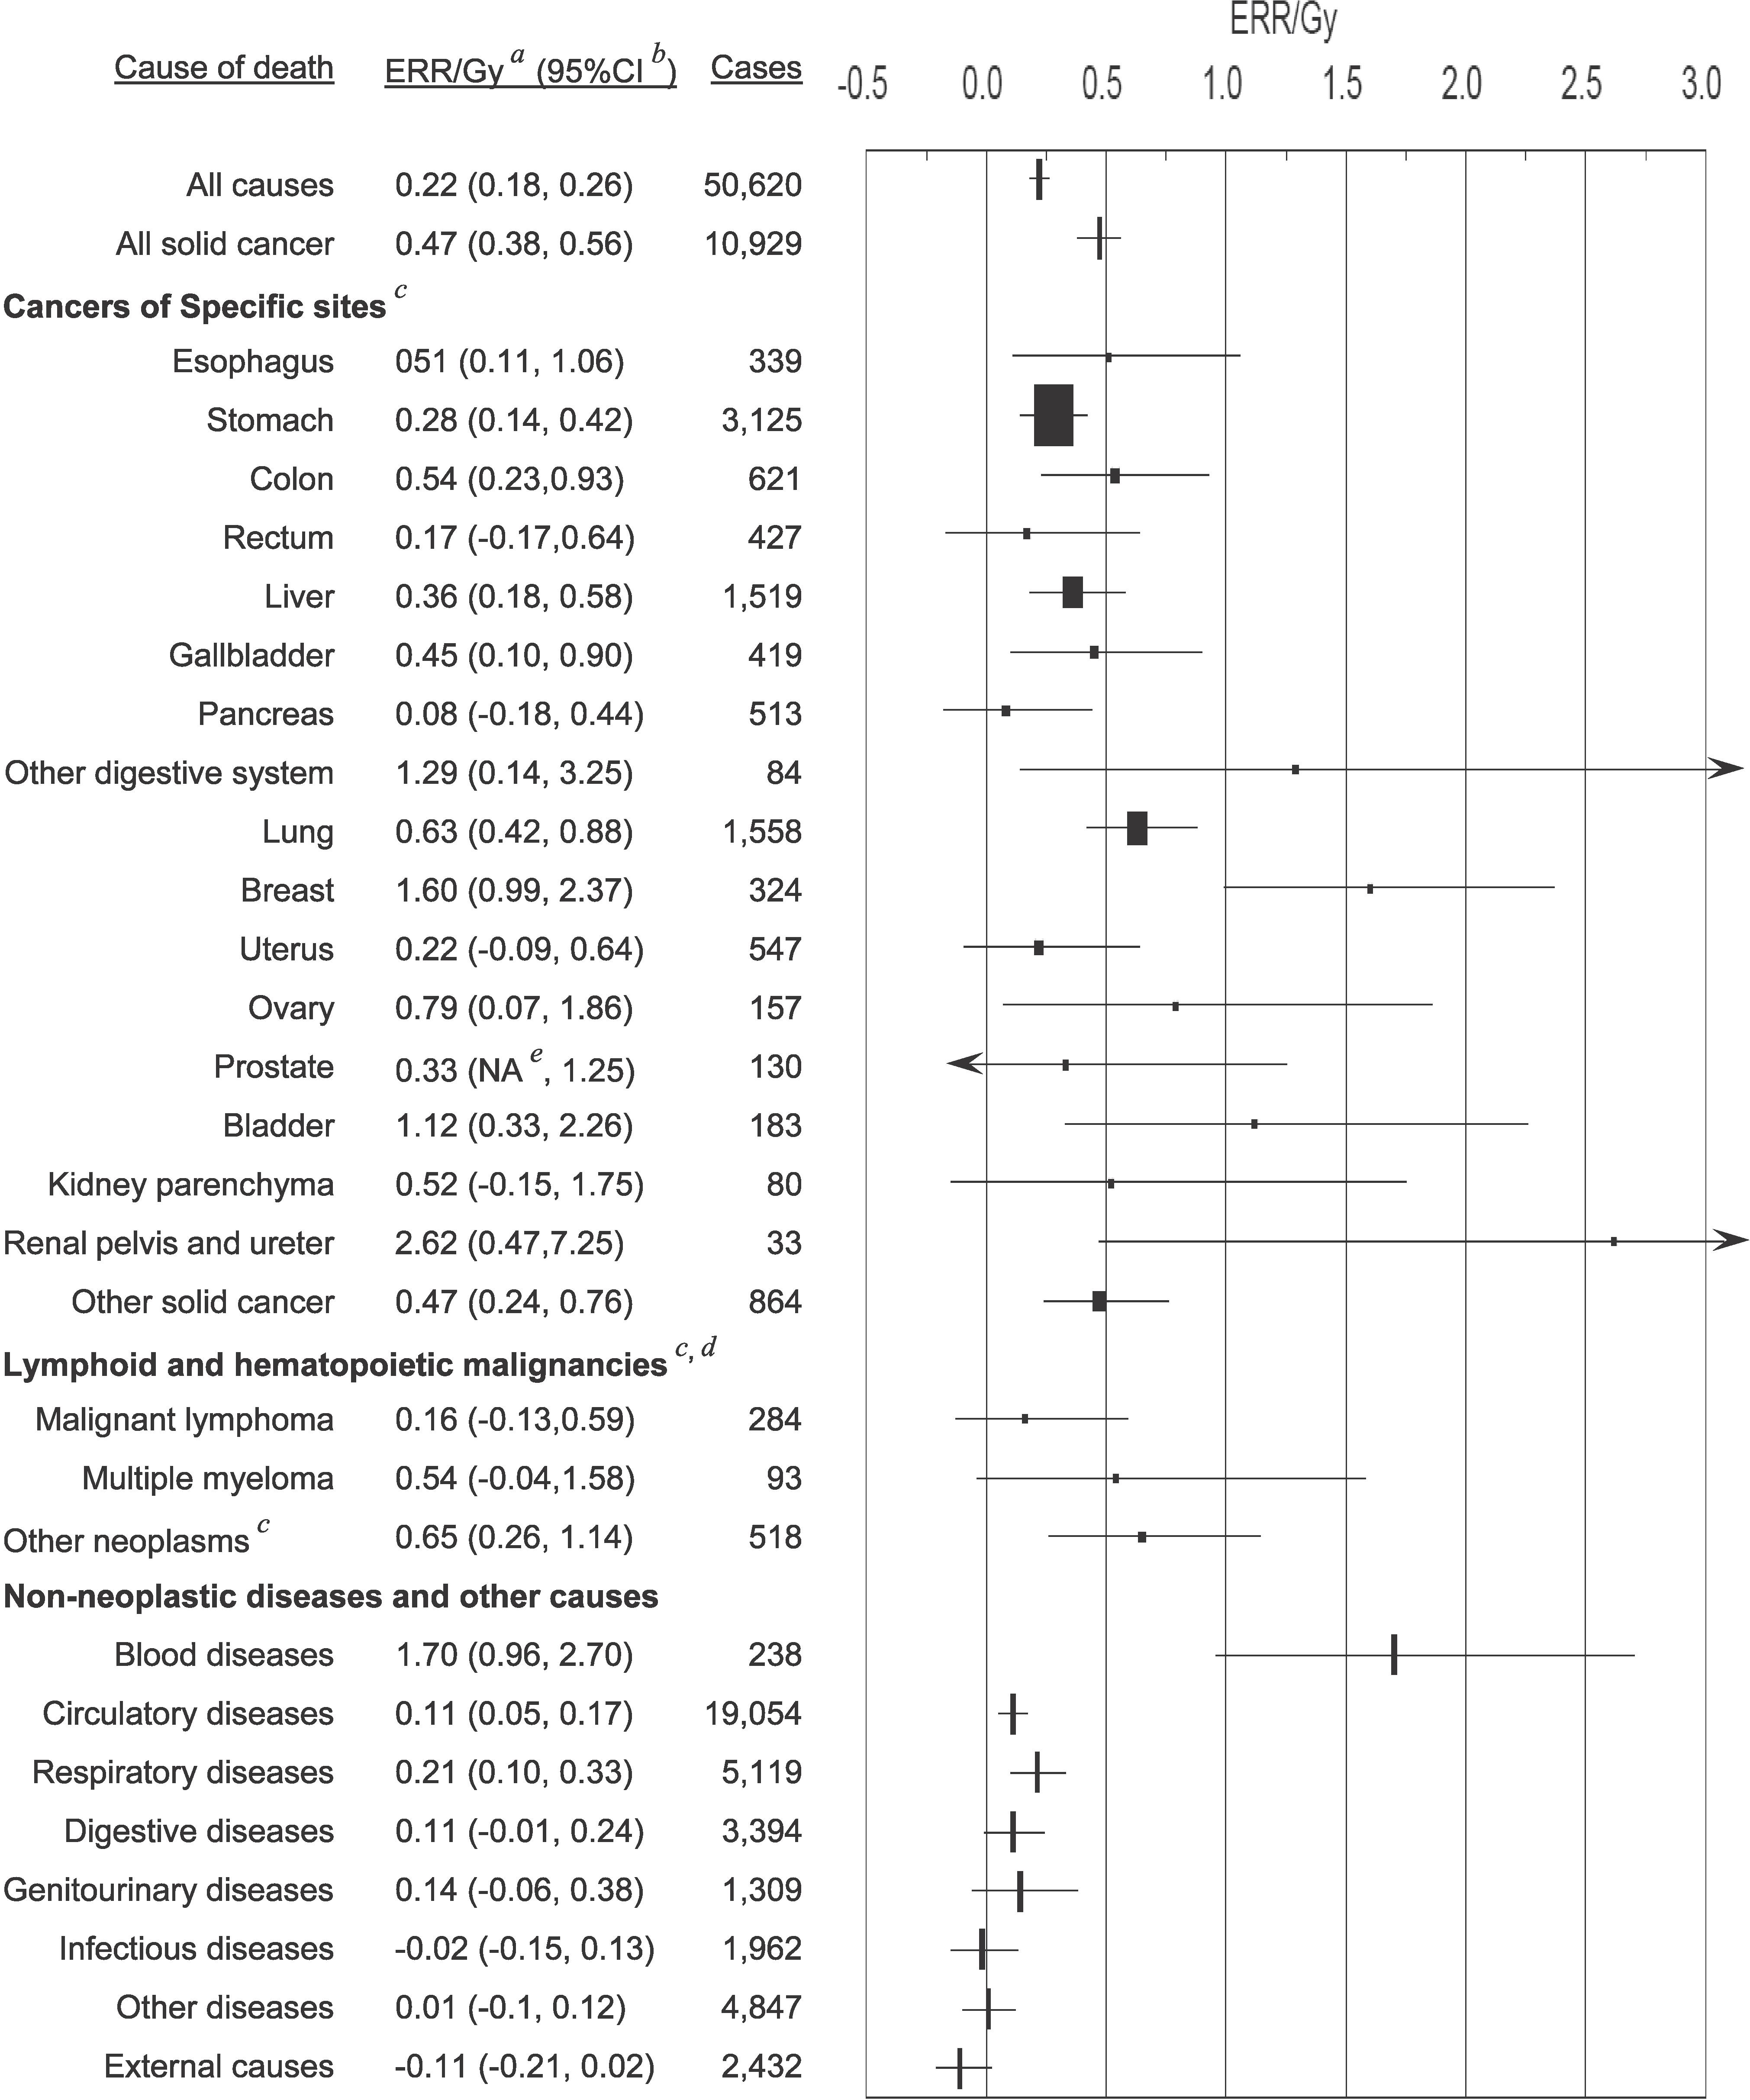
FIG. 1.
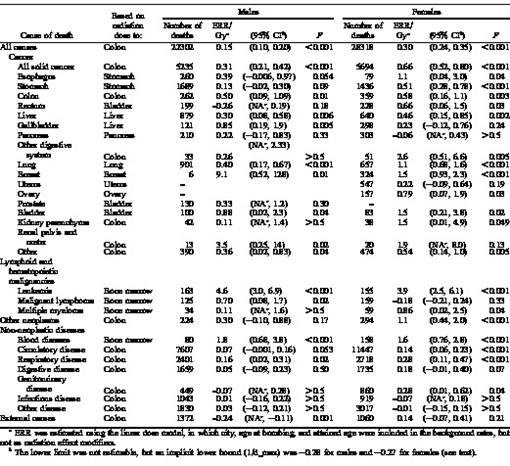
Estimates of excess relative risk (ERR) per Gy and 95% CI for major causes of death. a ERR was estimated using the linear dose model, in which city, sex, age at exposure, and attained age were included in the background rates, but not allowing radiation effect modification by those factors. b Confidence interval. Horizontal bars show 95% confidence intervals. c The size of plots for site-specific cancers was proportional to the number of cases. d ERR (95% CI) of leukemia was 3.1 (1.8, 4.3) at 1 Gy and 0.15 (−0.01, 0.31) at 0.1 Gy based on a linear-quadratic model with 318 cases (not displayed in the figure). e The lower limit of 95% CI was lower than zero, but not specified by calculation.
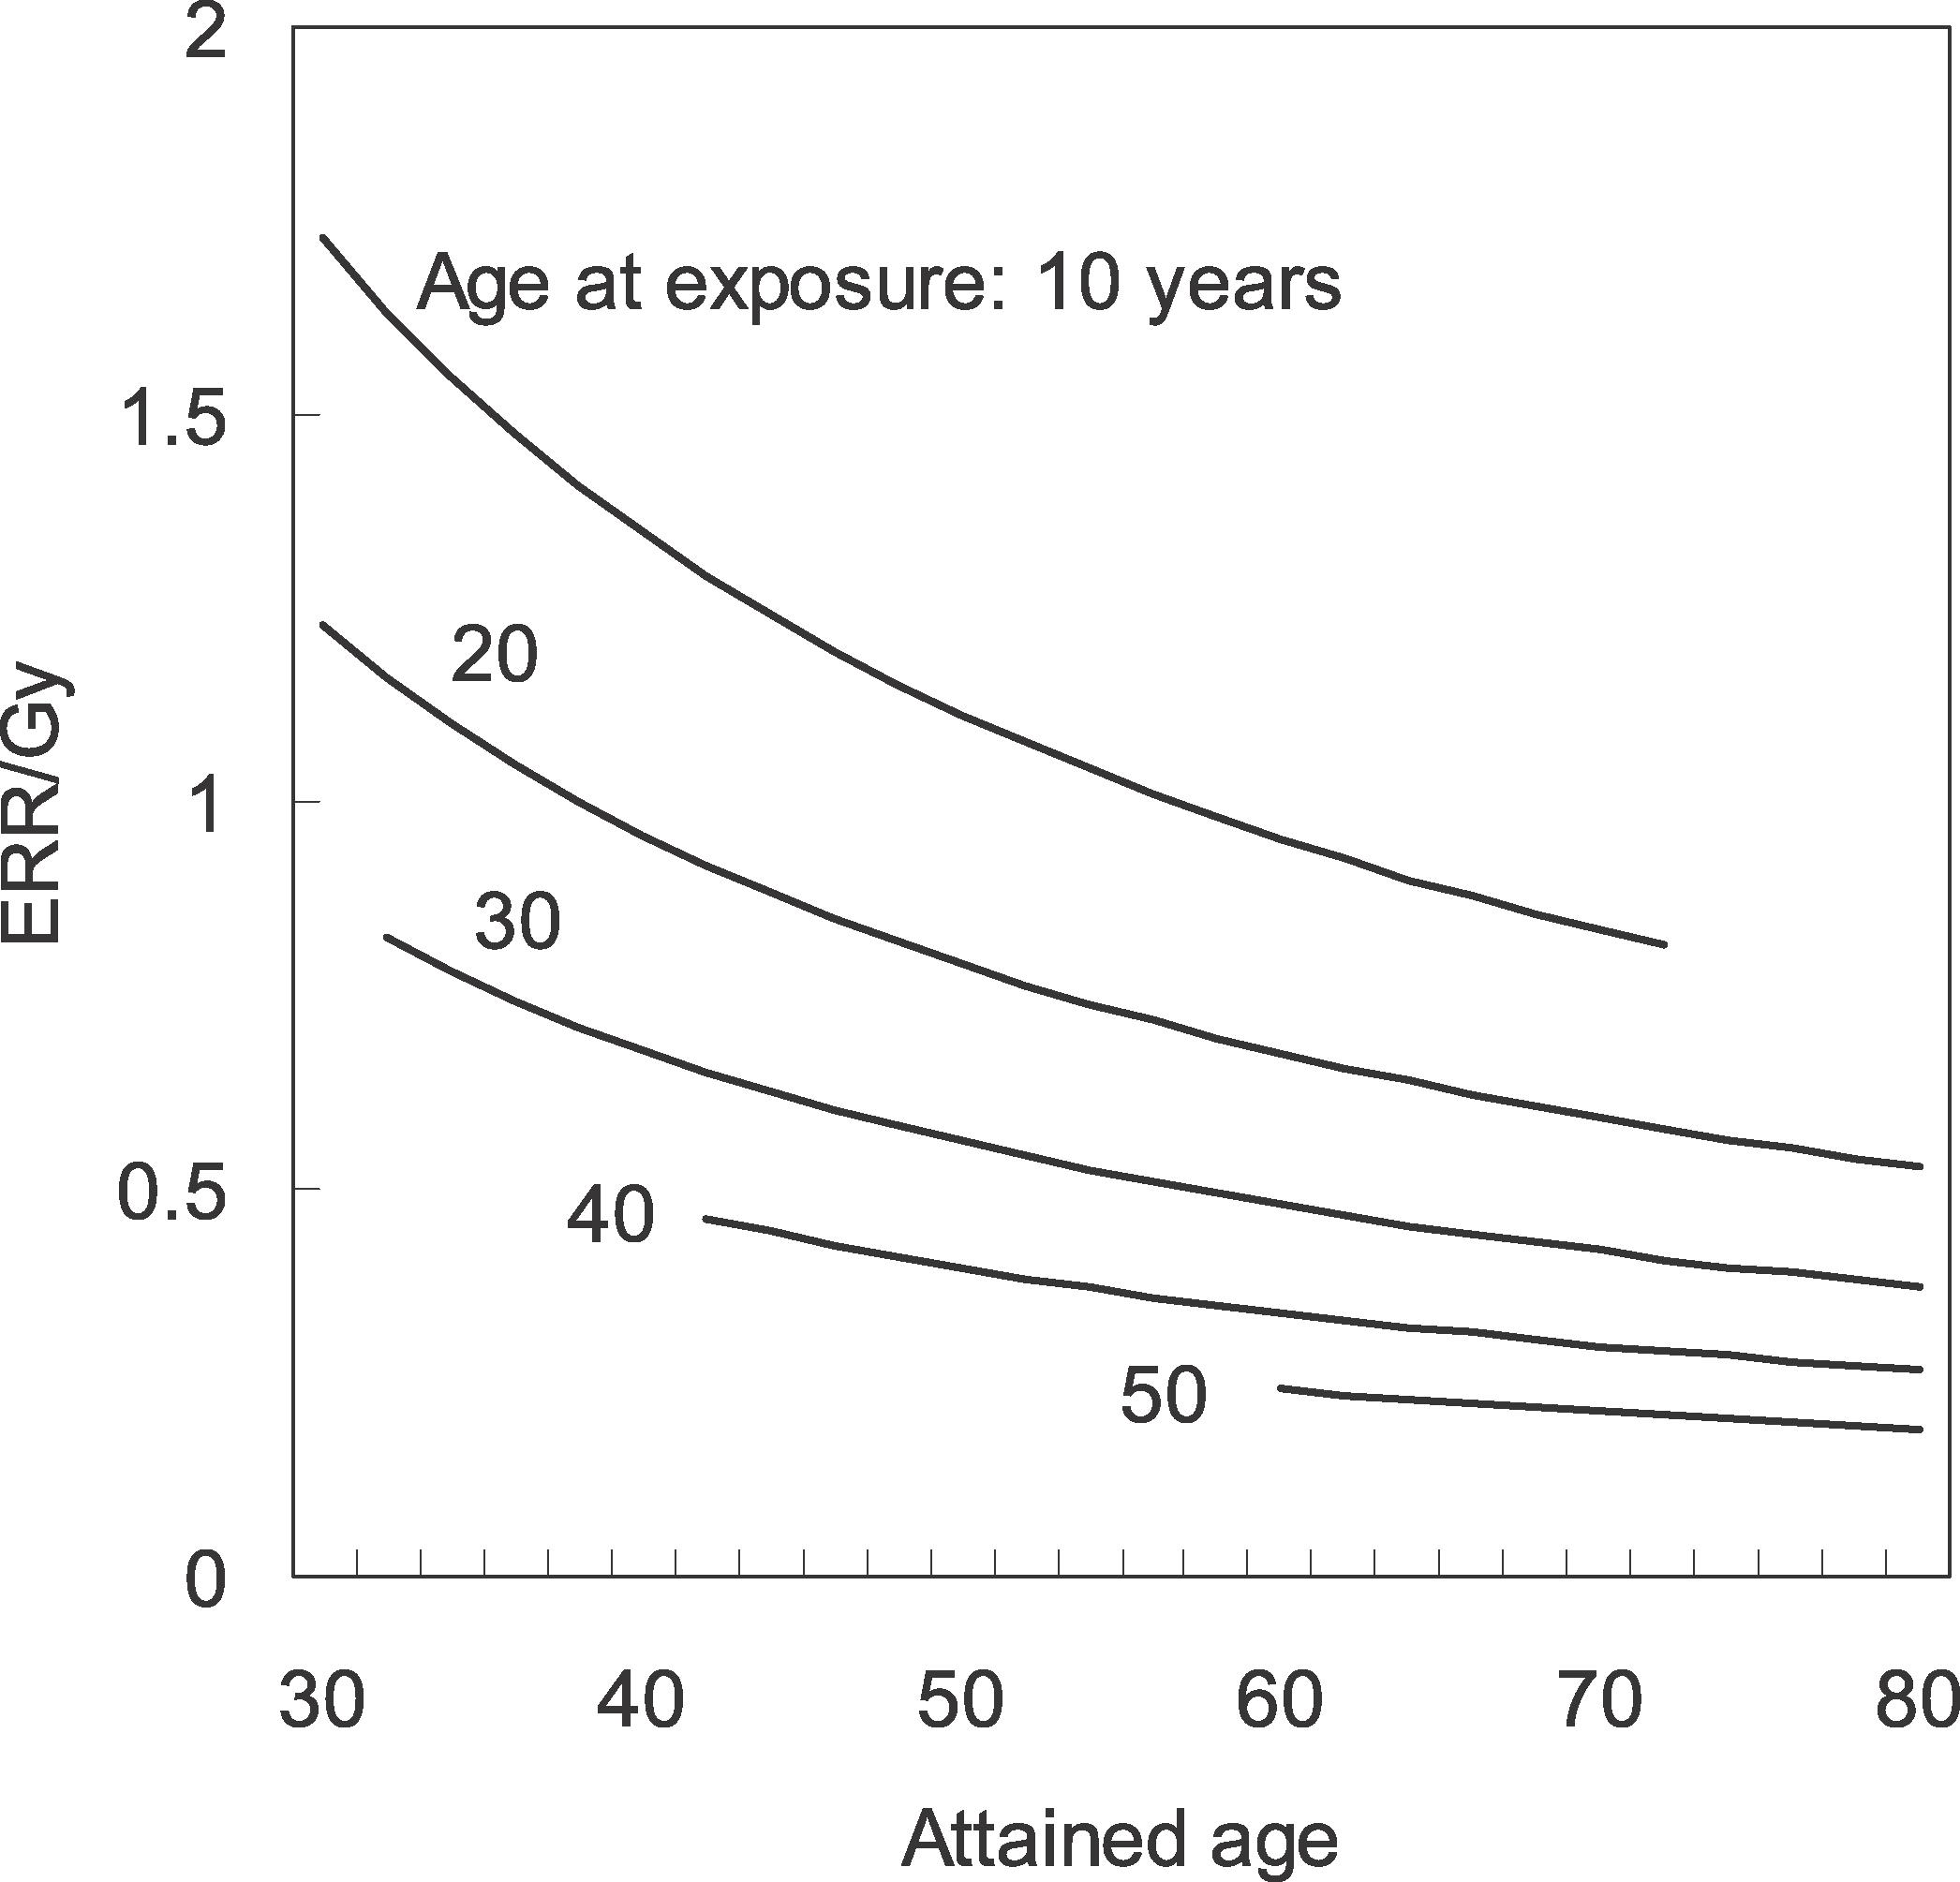
FIG. 2.
Modification of the excess relative risk (ERR) for all solid cancer by age at exposure and attained age.
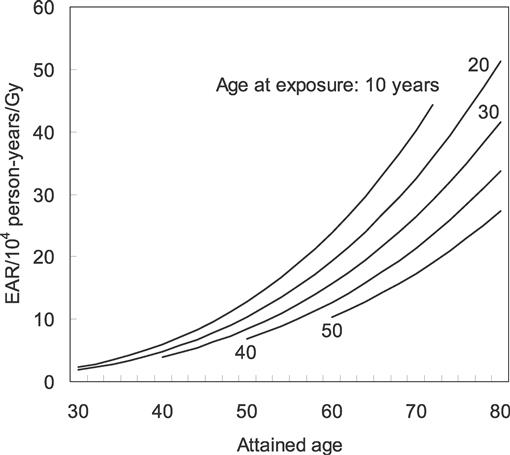
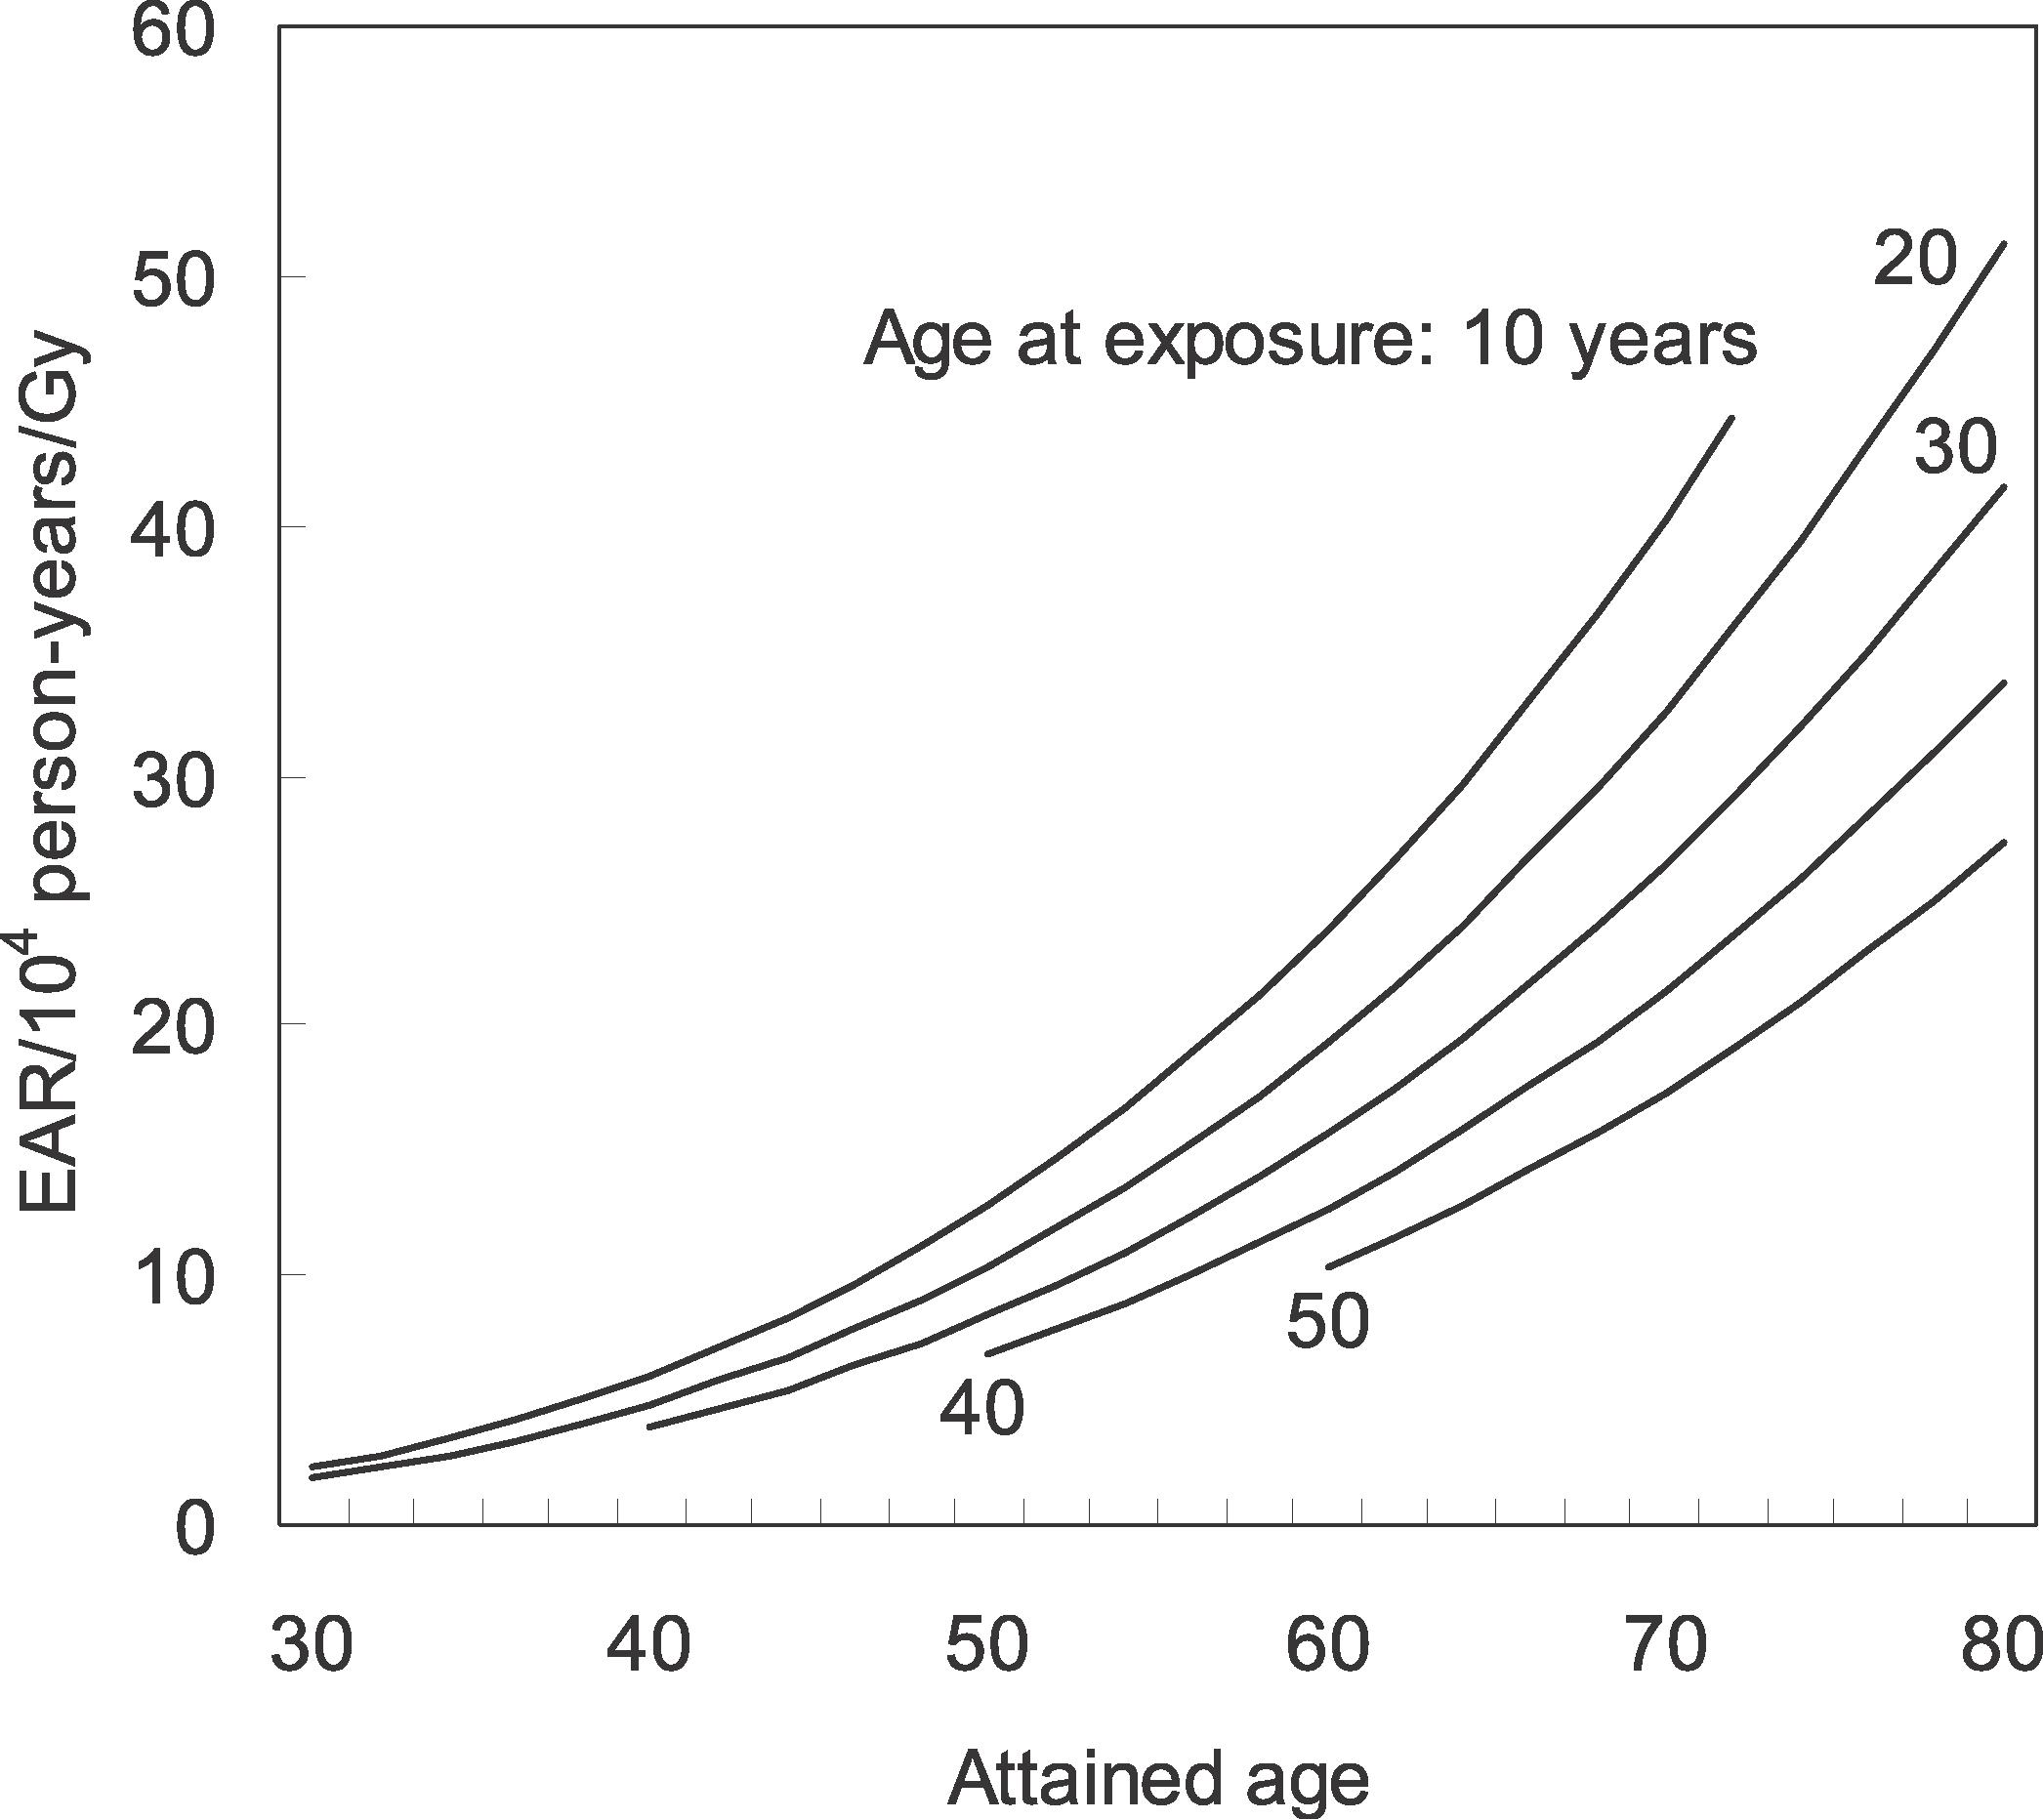
FIG. 3.
Modification of the excess absolute risk (EAR) for all solid cancer by age at exposure and attained age.
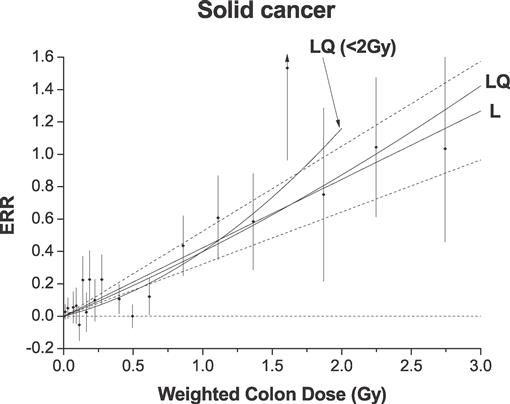
FIG. 4.
Excess relative risk (ERR) for all solid cancer in relation to radiation exposure. The black circles represent ERR and 95% CI for the dose categories, together with trend estimates based on linear (L) with 95% CI (dotted lines) and linear-quadratic (LQ) models using the full dose range, and LQ model for the data restricted to dose <2 Gy.
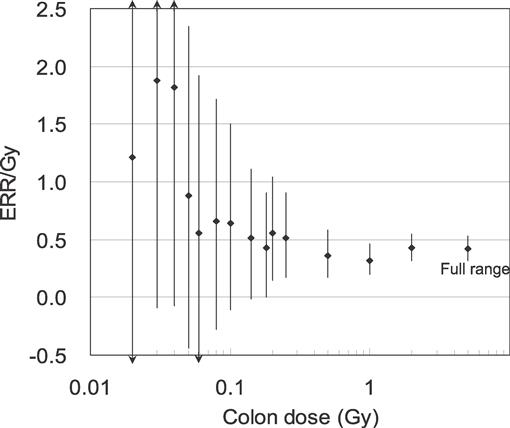
FIG. 5.
Excess relative risk per Gy (ERR/Gy) for all solid cancer for selected dose ranges. The figure shows the ERR/Gy and 95% CI for a dose range from zero to a given dose based on the linear model for the full data that allowed for different ERRs below and above the given dose and taking radiation effect modifiers as common to the two dose ranges. The increased ERR/Gy in the low-dose levels less than 0.1 Gy corresponds to the estimates of ERR higher than the expected linear line in Fig. 4.
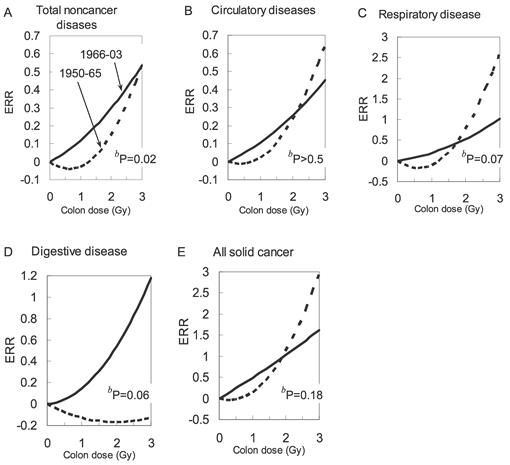
FIG. 6.
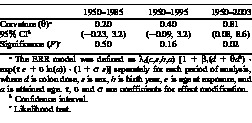
Comparison of dose–response curvea for early period (1950–1965, shown with dashed line) and for late period (1966–2003, shown with solid line) from noncancer diseases (based on LQ without any effect modification) and all solid cancer (based on LQ with effect modifications). aBased on the ERR model defined as the linear-quadratic model without effect modifications for noncancer diseases: λ0(c,s,e,a) [1 + β1(d + θd2)], and the model with effect modifications for all solid cancer: λ0(c,s,e,a) [1 + β1(d + θd2) · exp(τ e + υ ln(a)) · (1 + s s)], where d is colon dose, s is sex, e is age at exposure, and a is attained age. The figure for all solid cancer shows the sex-averaged estimates for e = 30 years and a = 70 years. bSignificance of the difference between the two curves.
TABLE 1
Number of LSS Cohort Members by DS02 Dose, City and Sex
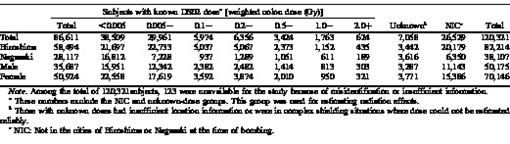
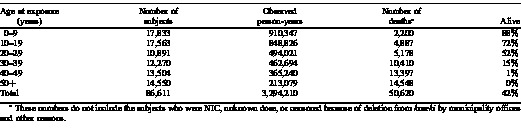
TABLE 2
Observed Person-Years and Number of Deaths in the LSS Cohort Members with Known DS02 Doses, as of January 1, 2004, by Age at Exposure
TABLE 3
Number of Deaths, Excess Relative Risk (ERR) Estimates per Gy for Specific Causes of Death by Sex
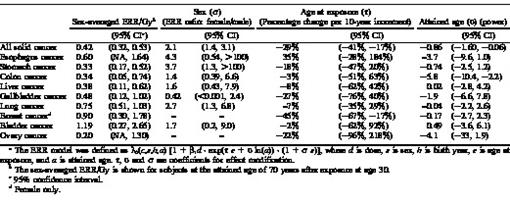
TABLE 4
Effect Modification of the Excess Relative Risk (ERR) Modela for Major Cancers
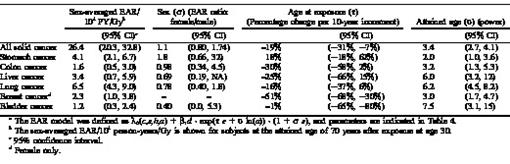
TABLE 5
Effect Modification of the Excess Absolute Risk (EAR) Modela for Major Cancers
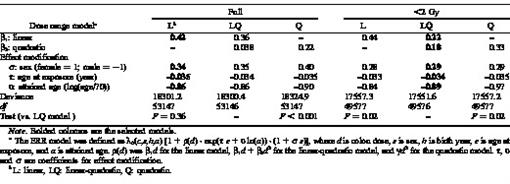
TABLE 6
Parameter Estimates of the Dose–Response Models for Excess Relative Risk (ERR) for all Solid Cancer in the Full Dose Range and for the Range of 0–2 Gy
TABLE 7
Change in Dose–Response Curvature For Excess Relative Risk (ERR) of Solid Cancer in The range of 0–2.0 Gy by Observation Period
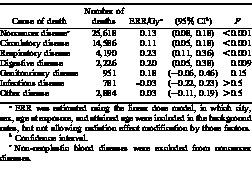
TABLE 8
Excess Relative Risk (ERR) Estimates per Gy for Noncancer Deaths, 1966–2003
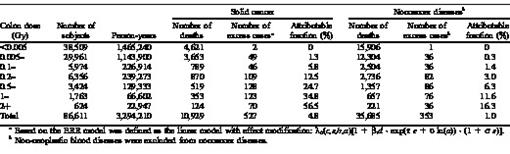
TABLE 9
Observed and Excess Deaths from Solid Cancer and Noncancer Diseases
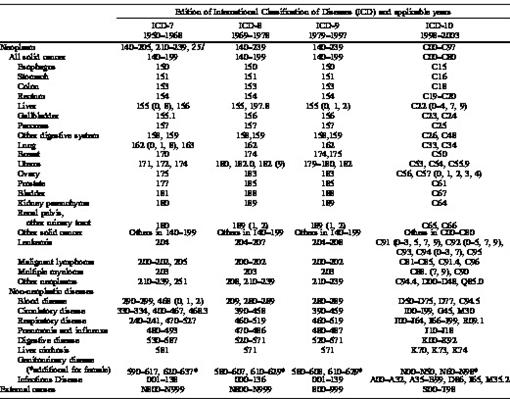
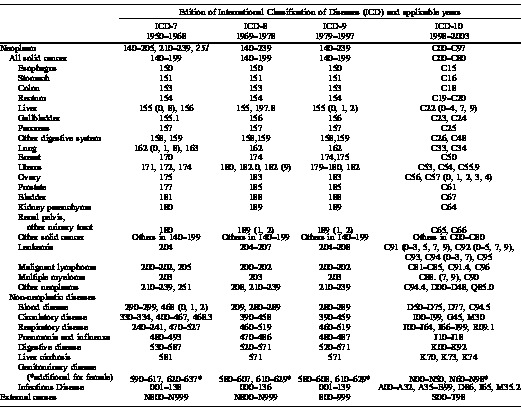
APPENDIX
Classification of Cause of Death in This Report


