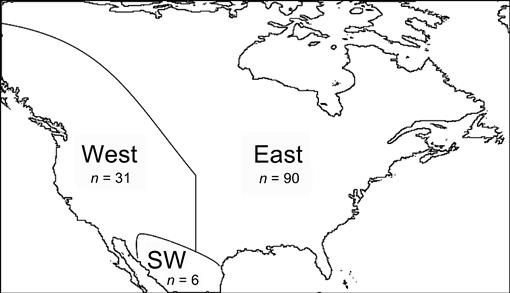
FIGURE 1.
Map of boundaries for western, eastern, and southwestern individuals. The boundary between east and west followed Kelly and Hutto (2005): the 100° longitude line in the southern part of the range and the Rocky Mountains in the north. The southwestern boundary matched the northern edge of the range of Geothlypis trichas chryseola. Four additional Mexican subspecies are part of the southwestern group but were not included because of the unavailability of archived recordings for these subspecies.
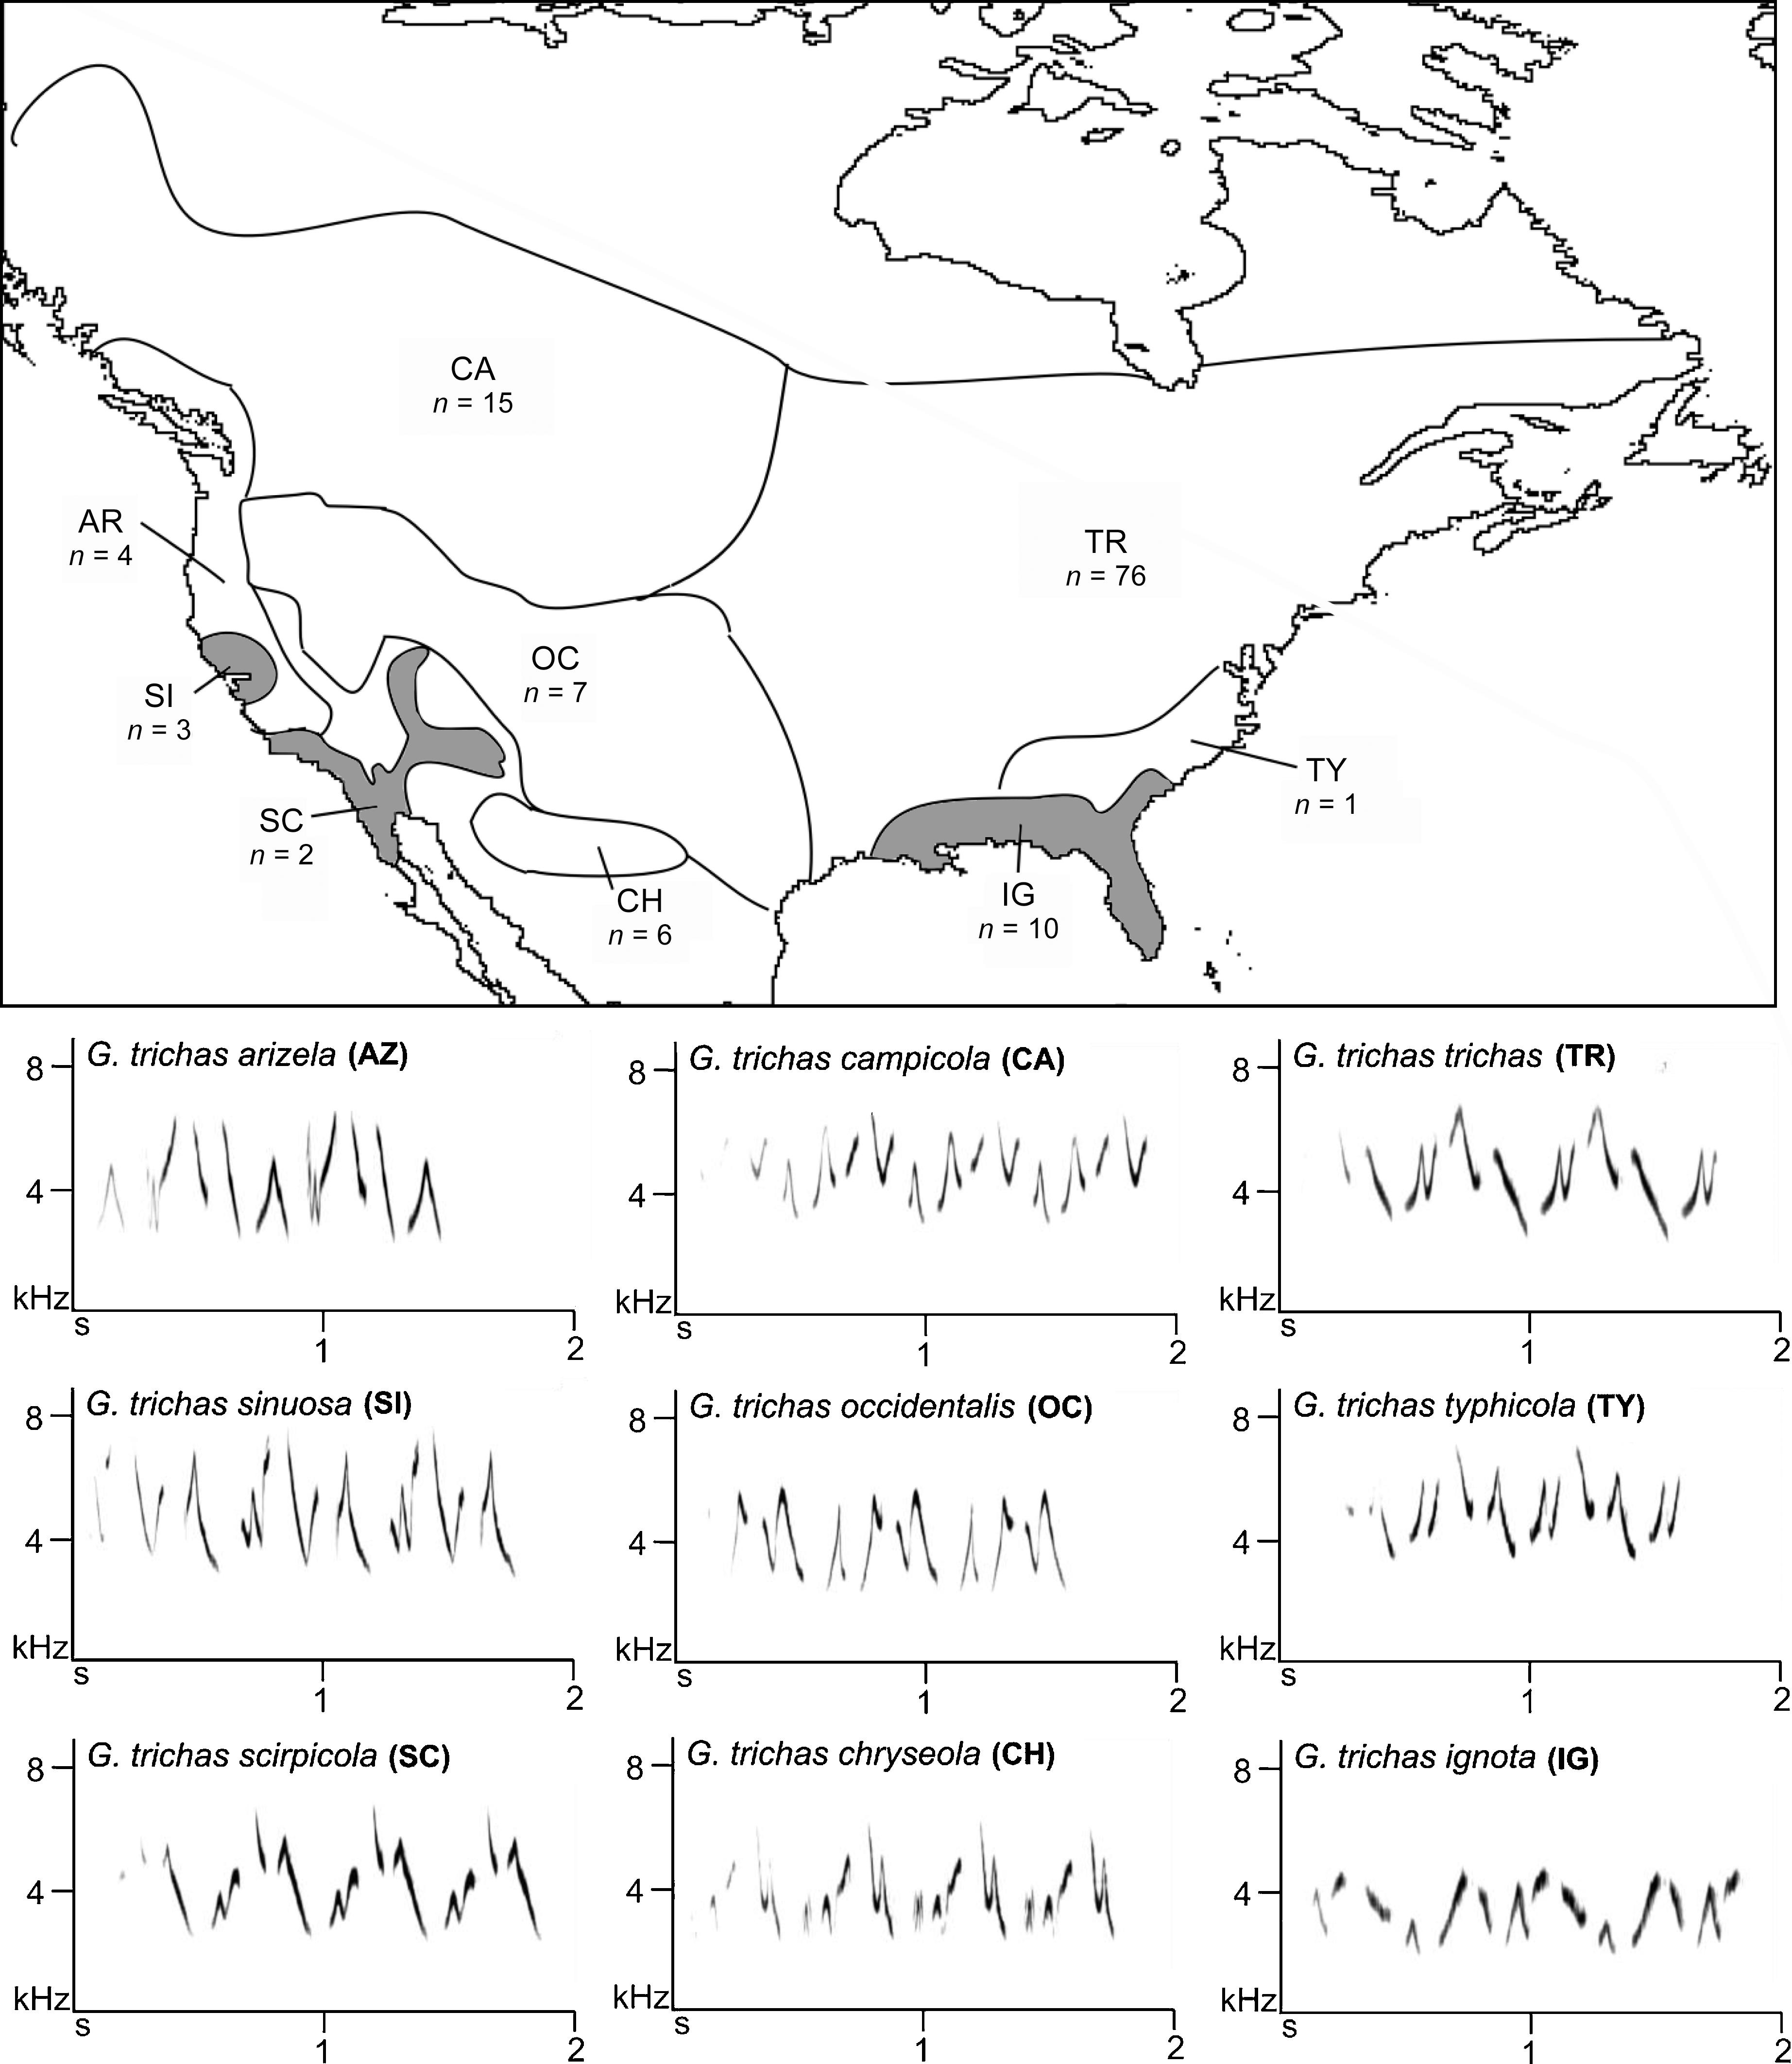
FIGURE 2.
Map of approximate subspecies boundaries (based on Behle 1950, Borror 1967, Pyle 1997, Van Rossem 1930), demonstrating spatial relationships among subspecies, and representative sonograms. The archived recordings analyzed for this study represented 9 of the 13 described Common Yellowthroat subspecies, all found in the United States and Canada. Subspecies that are sedentary year-round are indicated with gray shading. Representative sonograms from each subspecies demonstrate variation in frequency, note composition, and syntax. Sonograms are arranged geographically. (This map does not represent local abundances; Common Yellowthroat abundances are often extremely patchy in the dry southwestern United States.)
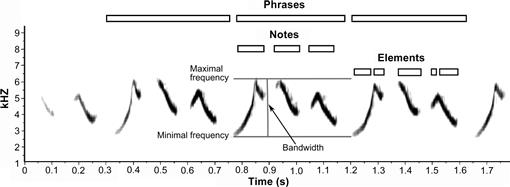
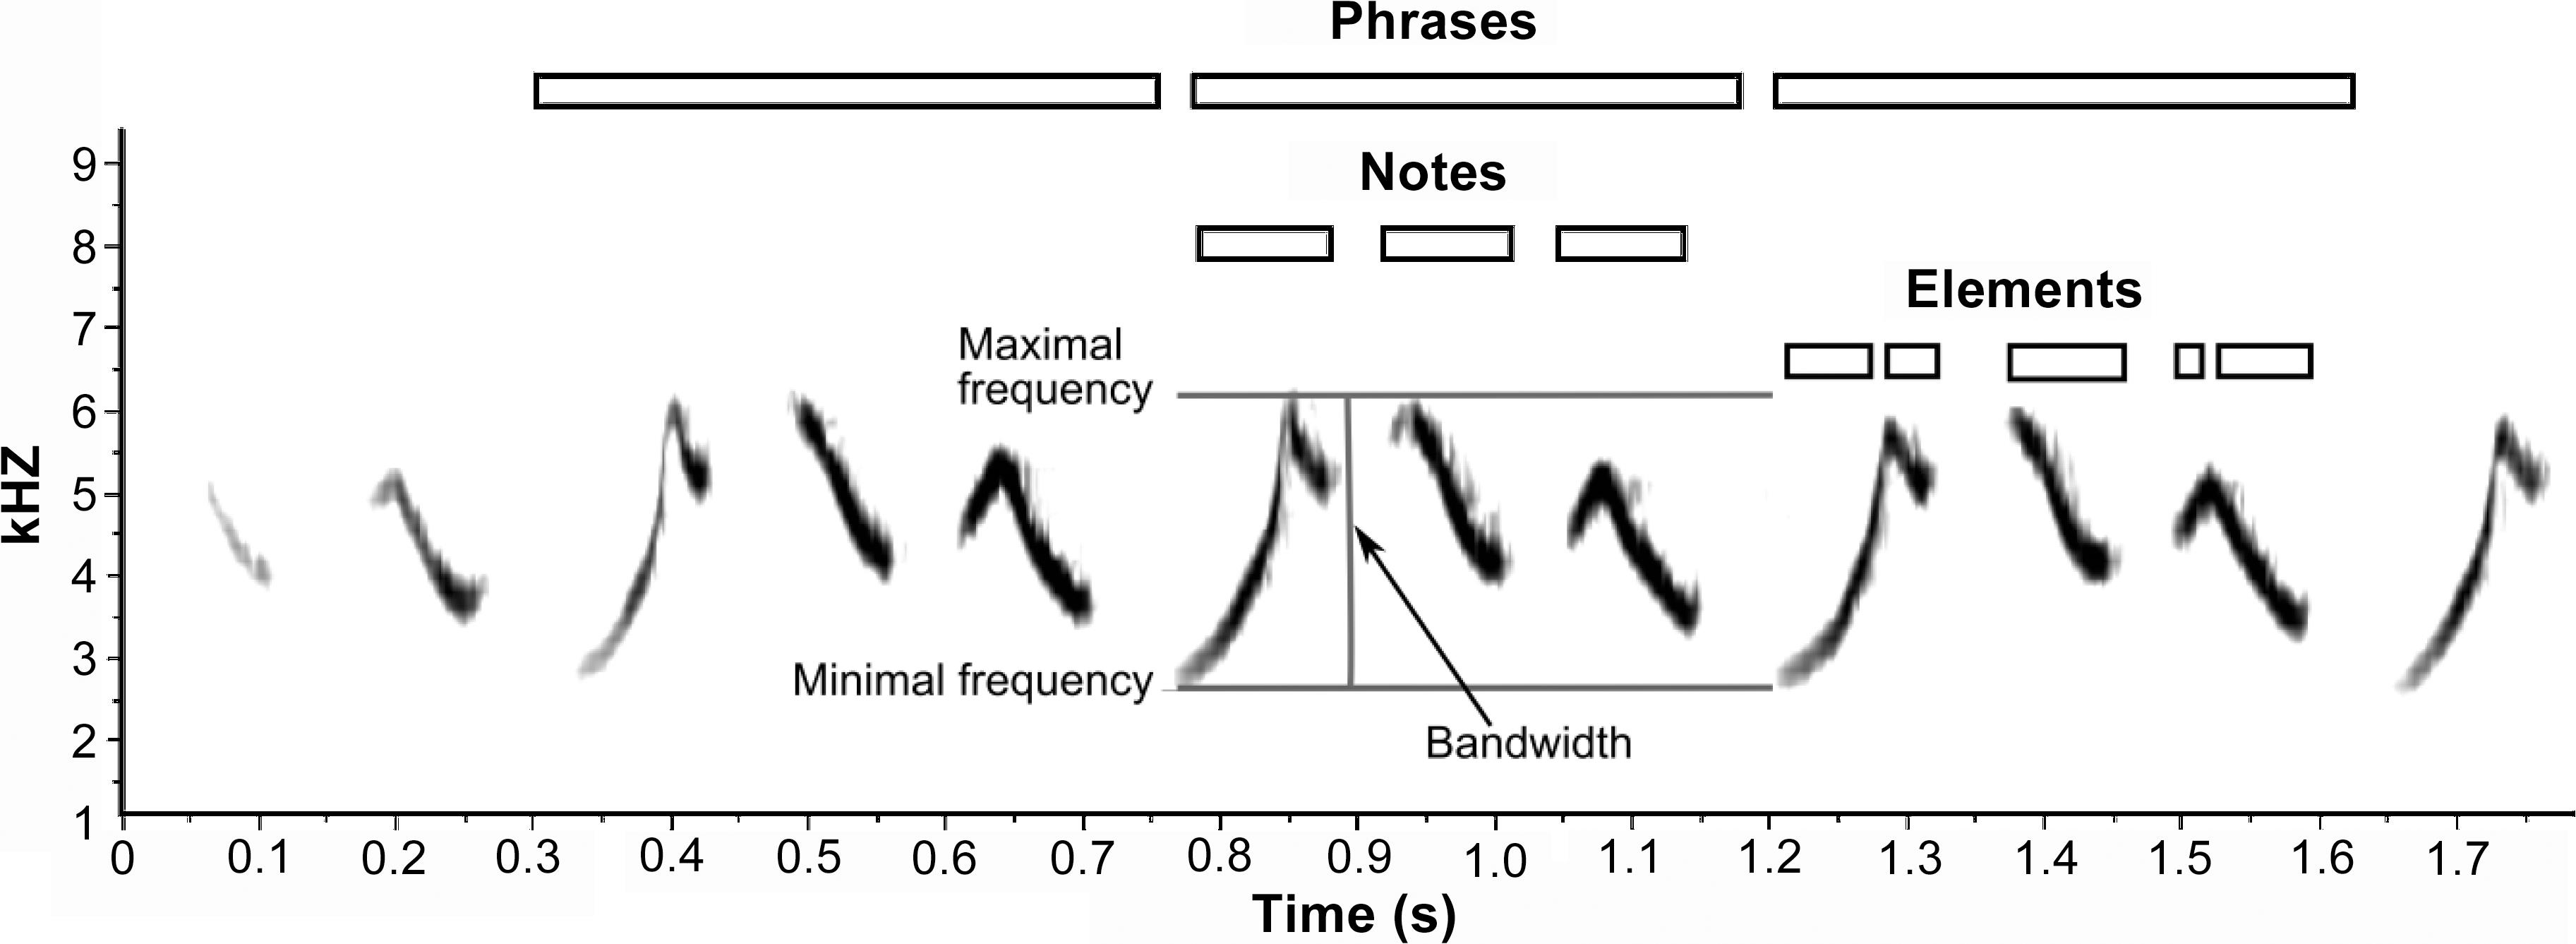
FIGURE 3.
Representative sonogram demonstrating song nomenclature and measurements. Common Yellowthroat perch songs are repeated phrases made up of two to six notes, which vary in number of elements. In each song the maximal frequency, minimal frequency, phrase duration, bandwidth, note durations, and internote durations were measured from each sonogram. Raven Pro calculated peak frequencies, and I counted the number of notes per phrase and the number of elements per note.
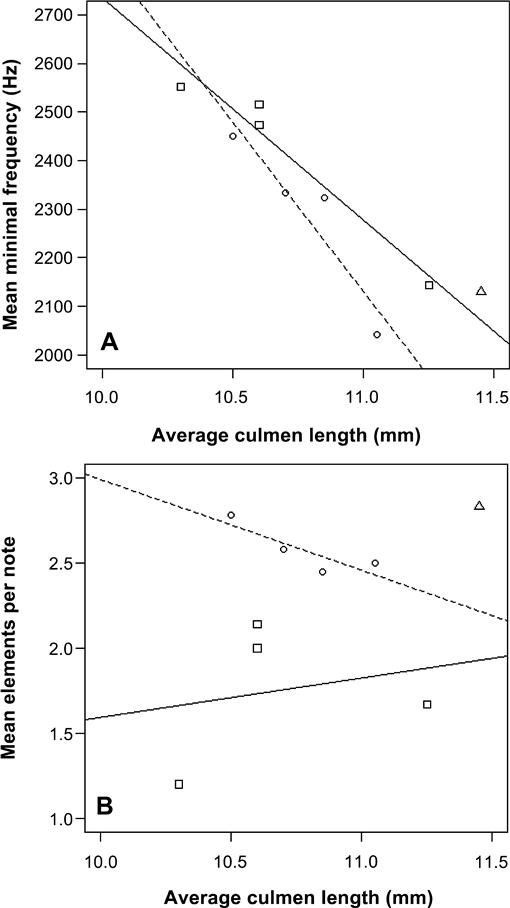
FIGURE 4.
Plot and fitted regression lines demonstrating the strong correlations between mean bill length and minimal frequencies in both the east and west (A) and mean bill length and number of notes per phrase in the west (B). Eastern points are represented with a square and a solid line, whereas western points are represented by a circle and a dashed line.
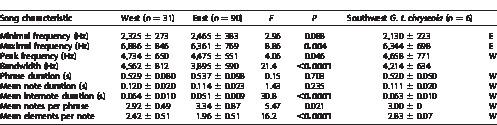
TABLE 1.
Western and eastern Common Yellowthroats differ in the spectral characteristics of song and in song-type elaborateness measures. The characteristics of the songs of the southwestern subspecies Geothlypis trichas chryseola are included for comparison. An “E” or “W” in the last column indicates whether the G. t. chryseola mean is more similar to eastern or western values, respectively. Significant values are in bold.
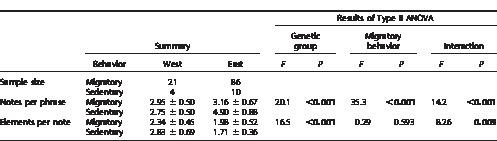
TABLE 2.
Summary of differences in song elaborateness between eastern and western Common Yellowthroat groups that differ in migratory behavior. Significant values are in bold.
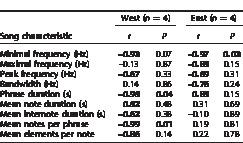
TABLE 3.
Pearson's correlations between mean subspecies bill length and mean subspecies song characteristics in the western and eastern Common Yellowthroat groups. Significant values are in bold.


