Immune defense is costly to maintain and deploy, and the optimal investment into immune defense depends on risk of infection. Altitude is a natural environmental factor that is predicted to affect parasite abundance, with lower parasite abundance predicted at higher altitudes due to stronger environmental stressors, which reduce parasite transmission. Using high and low altitude populations of the Turkish blind mole-rat (TBMR) Nannospalax xanthodon, we tested for effects of altitude on constitutive innate immune defense. Field studies were performed with 32 wild animals in 2017 and 2018 from two low- and one high-altitude localities in the Central Taurus Mountains, at respective altitudes of 1010 m, 1115 m, and 2900 m above sea level. We first compared innate standing immune defense as measured by the bacteria-killing ability of blood serum. We then measured corticosterone stress hormone levels, as stressful conditions may affect immune response. Finally, we compared prevalence and intensity of gastrointestinal parasites of field-captured TBMR. We found that the bacteria-killing ability of serum is greater in the mole-rat samples from high altitude. There was no significant difference in stress (corticosterone) levels between altitude categories. Coccidian prevalence and abundance were significantly higher in 2017 than 2018 samples, but there was no significant difference in prevalence, abundance, or intensity between altitudes, or between sexes. Small sample sizes may have reduced power to detect true differences; nevertheless, this study provides support that greater standing innate immunity in high altitude animals may reflect greater investment into constitutive defense.
INTRODUCTION
Parasites are ubiquitous in wild populations and can affect host birth and death rates (Hudson et al., 2002) and shape population demographics (Hudson et al., 1998; Pedersen and Greives, 2008; Forbes et al., 2014). Thus, it is no surprise that parasites are powerful agents of selection that promote rapid evolution of host resistance (Altizer et al., 2003). However, immunity is not without its own costs (Lochmiller and Deerenberg, 2000), which can take such forms as energy consumption and immunopathology during immune system activation (Råberg et al., 2009). For an individual, investment in immune response should depend on the strength of selection imposed by parasites and the availability of resources that can be allocated to different physiological functions (Sheldon and Verhulst, 1996; Durso and French, 2017).
In light of this balance, investment in immune response may be particularly costly at high altitudes, which are characterized by environments with extremely limited resources, such as less land area (and thus lower food supply), lower atmospheric pressure (and thus oxygen availability), and lower temperatures (Körner, 2007). However, mammals have been shown to adapt to some of these stressors. For instance, to cope with the lower oxygen availability at high altitudes, many mammals possess hemoglobin variants with stronger oxygen affinity (reviewed in Storz, 2007), and high-altitude Andean mouse (Andinomys edax) species brought to sea level still show increased carbohydrate use as a metabolic strategy to conserve energy (Schippers et al., 2012). Thus, environmental pressures at high altitudes may promote immunologic adaptations in animals living under those harsher conditions.
In addition to affecting host adaptation, extreme conditions at high altitude can also affect parasite abundance. High-altitude conditions can limit parasite abundance by reducing speed of development (LaPointe et al., 2010), by increasing mortality from lower temperatures and increased exposure to solar radiation during free-living stages (Zanet et al., 2017), and by reducing the availability of vectors for transmission (van Riper et al., 1986; Michel et al., 2014). While these previous studies point to reduced parasite abundance at higher altitudes, other studies have found increased parasite burden on individual hosts. This may be due to greater nutritional stress, leading to decreased physiological condition and increased susceptibility to infection among high-altitude animals. For example, higher helminth egg output rates in montane compared to lowland baboons was linked to lower resource availability and increased malnutrition in montane areas (Appleton and Henzi, 1993). In addition, host species that are concentrated on the reduced space at higher altitudes may experience increased parasite burden, because higher host density increases the transmission of many parasites (McCallum et al., 2001) and density promotes greater parasite abundance (Arneberg et al., 1998). Thus, it is unclear whether parasite prevalence and intensity are directionally correlated with altitude; more research is needed to address these questions.
In summary, individuals are expected to maximize fitness by minimizing costs from both parasites and immune defenses. Therefore, in the absence of parasites, animals should reallocate energy resources away from unnecessary and energetically expensive immune defense mechanisms to biological functions associated with greater fitness (Blossey and Notzold, 1995; Sheldon and Verhulst, 1996; Zuk and Stoehr, 2002; Viney et al., 2005; Lee, 2006). Accordingly, if parasite pressure is lower at higher altitude, adaptations should lead to different optimal immune defense among high- and low-altitude populations.
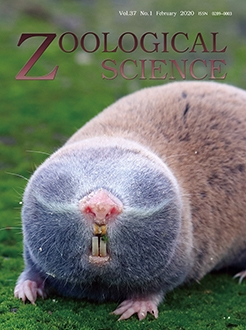
The Turkish blind mole-rat (TBMR), Nannospalax xanthodon (Satunin, 1898), is a solitary subterranean rodent found from sea level up to 3000 m asl in Anatolia. Each individual constructs its own system of underground tunnels and rarely leaves it unless forced. Population density of Nannospalax genus is up to six animals per 1000 m2 in Turkey (Sözen, 2005). To our knowledge, there have been no studies on the dispersal range of the TBMR; however, a closely related species, the Palestinian mole-rat (Nannospalax ehrenbergi) is known to occasionally make tunnels in long straight lines up to 300 m during the mating season (Rado et al., 1992). The TBMR has the highest diversity of chromosomal forms (cytotypes) among the Palearctic mammals, with each cytotype occupying its own distinct geographical area (Zima, 1993; Arslan et al., 2016). It is very likely that most, if not all, of these chromosomal forms are reproductively isolated (Arslan et al., 2016). Both low dispersal ability and high degree of cryptic speciation create high potential for local adaptation between populations (e.g., Bultin et al., 2014).
Fig. 1.
Map of sampling locations. Previous surveys in the region revealed the two areas of Eregli and Medetsiztepe as the geographically closest sites with the greatest elevation difference (unpublished data).

In light of these ideas, we compared the innate standing immune defense, stress levels, and gastrointestinal parasite prevalence, abundance and intensity among three populations of TBMR from low and high altitude (1010 m asl to 2900 m asl) to address two interrelated questions: (i) Are TBMR innate standing immune response and stress levels influenced by altitude? (ii) Do parasite richness, prevalence, and intensity differ among TBMR populations by altitude?
MATERIALS AND METHODS
Sites and field sampling
TBMRs were captured for two consecutive years (2017–2018) at three sites in Turkey (Fig. 1): ‘low altitude' Ereğli 1, (1010 m asl.) and Ereğli 2, (1115 m asl.), and ‘high altitude’ Medetsiztepe/Bolkar Mountains, (2900 m asl). TBMRs are known for the exceptional diversity of chromosomal races. All populations used on this study were previously described as a part of the same chromosomal race (cilicicus), diploid chromosome number 2n = 58 (Sözen and Kıvanç, 1998; Arslan et al., 2016). Annual mean temperature and mean precipitation at the high altitude is 0.16°C and 744.6 mm, respectively; and 11°C and 344.7 mm at the low altitude, respectively. Partial snow cover is present until June at high altitude, and may limit digging activities and access to water for these animals. Both high and low altitude sites were characterized by grassland (Leguminosae, Asteraceae and Poaceae families). Bulbous plants (such as Ornithogalum sp., Gagea sp.) are the preferred food source for TMBR (Sözen, 2005) and were present at high altitude. Food availability is one of the major factors affecting population density in a closely related species Nannospalax ehrenbergi (Lövy et al., 2015), as it is more generally for omnivorous, granivorous, and herbivorous small mammals (Prevedello et al., 2013).
We caught six animals from high altitude and three animals from low altitude in October 2017, and 11 animals from high altitude and 12 animals from low altitude in June 2018. The sample size for each assay by population and altitude is shown in Table 1. Animals were live-captured by opening the burrow passageways at specific sections and blocking retreat when the animal is mending the tunnel (Wertheim and Nevo, 1971).
On capture, we weighed animals and determined their sex and sexual maturity status. We collected fecal samples and stored them in 95% ethanol. For blood collection, we could not use the saphenous vein because it was impossible to locate under field conditions, so we collected approximately 100 µl blood by heart puncture with a 0.30 mm (30G) × 8 mm gauge needle injector (BD micro-Fine™ Plus, U-100 Insulin) and placed the whole blood in an (2 mL) Eppendorf tube. The time spent between first capture until blood collection was recorded as “time held (minutes)”. After collecting blood, the animals were monitored for two hours and then released back into their own nests. Blood was allowed to coagulate and then put on ice and stored for 5–6 hours, after which the serum was separated and frozen until further processing.
After collection, blood samples were centrifuged to separate serum and red blood cells via portable centrifuge (Alfagen Mini Centrifuge, Mini-7K) at 7000 rpm for 15 minutes. Serum and whole red blood cells were stored separately in (1.5 mL) Eppendorf tubes. Samples were stored at – 4°C in the field, and then moved to – 80°C once at the lab. For the bacteria-killing (BKA) and corticosterone assays, we only used the 2018 samples, because prolonged freezing and frost–defrost conditions experienced by 2017 samples may affect concentrations of biochemical components and hormones in serum (Bielohuby et al., 2012). Thus, running frozen and fresh samples in same assay is not recommended (but see Hegemann et al., 2017). Moreover, it is suggested to use fresh samples whenever possible (Jacobs and Fair, 2015).
Animal handling and usage were approved by the Animal Ethics committee of Bülent Ecevit University (#91330202).
Bacteria-killing assay
Optimization of incubation time and serum dilution was carried out prior to the bacteria killing assay (see Supplementary Materials (10.2108.zsj.37.31.s1.pdf)). Samples were thawed (15 min at room temperature), and then run in duplicate to provide greater accuracy. We modified the method of French and Neuman-Lee (2012) to prepare the plates. First, we plated positive controls and negative controls by adding 18 µl of PBS and 24 µl of PBS, respectively (TPP 96 well cell culture round bottom microplates). To the duplicate sample wells, we then added 6 µl of serum and 12 µl sterile PBS (1M 10× PBS; 1:2, or 3× dilution) to each and added 6 µl of the bacteria working solution to all wells, except negative controls. Plates were incubated in the plate shaker for 30 min at 37°C, at 150 rpm and then we added 125 µl TSB to each well. We then incubated plates in the plate shaker for a further 10 hours at 37°C, at 150 rpm. Next, we read the plate at both 300 nm and 340 nm to measure the absorbance at time 0. We also read two blank wells to determine the background absorbance.
Table 1.
Sample size for each assay by population and altitude.

To calculate bacteria-killing ability, we followed previous authors (Liebl et al., 2009; French and Neuman-Lee, 2012) and first subtracted the background absorbance readings (blanks) from the sample absorbance readings to control for the initial coloration in the wells. Microbicidal capacity was calculated as 1 minus the mean absorbance for each sample (samples were run in duplicates), divided by the mean absorbance for the positive controls (wells containing only bacteria and TSB), and multiplied by 100 (i.e., % bacteria killed relative to the positive control). We ensured that the negative control absorbance values did not vary between the pre- and post-incubation read.
Stress (corticosterone) assay
We proceeded with the stress assay shortly (10–15 min) after initiating the bacterial killing assays to avoid re-thawing our samples (as this may affect the quality of samples). The level of corticosterone, which is the main stress hormone in Spalax syn. Nannospalax and other subterranean rodents (Ganem and Nevo, 1996; Moshkin et al., 2002; Vera at al., 2012), was measured in serum using a commercial enzyme immunoassay kit, following the instructions provided (DetectX® Corticosterone Enzyme Immunoassay Kit). Samples were run in duplicate, and we calculated the coefficient of variation to determine the repeatability of our corticosterone measurements. The intra-assay (average percent) coefficient of variation for corticosterone concentration for duplicates (n = 19) was 7.8% (range = 0.0 to 25.7%). Four individuals had CV > 15% (range 15.9 to 25.7%), but we were unable to repeat the assay due to the limited amount of serum. The mean (and SD) corticosterone concentration across all individuals was 11.04 µg/dL (SD = 6.38) and did not significantly change by removing these four individuals (mean = 12.61 µg/dL (SD = 6.20), two sample t-test: t = –0.720, df = 30.58, P = 0.477). Thus, we retained all individuals for statistical analyses. Mean corticosterone concentrations were calculated from duplicates, referred to as MCC hereafter. Absorbance was read at 450 nm by plate reader (Thermo Scientific, Multiskan™ GO Microplate Spectrophotometer). The standard curve was calculated using online software ( www.myassays.com/arbor-assayscorticosterone-enzyme-immunoassay-kit.assay).
Gastrointestinal parasite assay
Spalacinae are commonly infected by numerous parasite species, including gastrointestinal helminths and coccidians (Wertheim and Nevo, 1971; Sayin et al., 1997; Sayin, 1980; Nalbantoglu et al., 2010). Oocysts of coccidia are shed in the host feces and transmitted via the fecal–oral route. Oocysts are only infective after the sporulation stage, which occurs in the environment, and so are subject to environmental conditions. The most important environmental factors are temperature, moisture, oxygen level, and ultraviolet light (UV) (Fayer, 1980), all of which are strongly associated with environmental gradients. Similarly, helminth parasites common to Spalax are either soil-borne nematodes, or insect-transmitted nematodes and cestodes (Wertheim and Nevo, 1971), and thus are also subject to environmental factors that become increasingly severe with altitude.
To identify the presence and intensity of gastrointestinal parasites of N. xanthodon we collected fecal samples from animals in the field. Noninvasive fecal egg counts are commonly used as an approximate indicator of worm burden, and have been shown to correlate with the ability of the host's immune system to regulate worm burden and fecundity (Stear et al., 1995). However, due to our method of capture, we were unable to consistently collect mole-rat fecal samples at the same hours of the day, and this may increase noise in any true patterns (Lopez et al., 2007). Using samples collected from 19 individuals (eight high- and 11 low-altitude; eight from 2017 and 11 from 2018), we used salt flotation with sodium nitrate solution (specific gravity 1.2–1.5) to isolate the oocytes and eggs of gastrointestinal parasites (Dryden et al., 2005; Winternitz et al., 2012). We scanned the cover slips in five replicate zigzag transects at both 100 × and 400 ×, and then quantified the parasite oocytes and eggs per gram of feces. To obtain the fecal mass (g) we weighed collection tubes containing the fecal samples stored in 95% EtOH and subtracted the mass of collection tubes with the same volume of EtOH.
Data analysis
Bacteria-killing and corticosterone assays
We analyzed the serum samples from 19 individuals (15 female, four male) for the bacteria-killing assay (BKA) and for the corticosterone assay. For these assays, we only used 2018 samples, as our serum samples from 2017 were not consistently frozen and this may affect the accuracy of results. We had unequal representation of the sexes, with almost four times as many females as males, so we ran models for males and females combined, as well as for females separately.
We performed model selection to strike a balance between overfitting and underfitting due to our small sample size. Global models were fit for the response variables BKA and mean corticosterone concentration (pg/mL) using the r package glmulti (Calcagno and de Mazancourt, 2010). The best model had the lowest AICc value, and was selected from the combination of variables we thought to be important for predicting the BKA and the mean corticosterone concentration. Models within 2 ΔAICc units of the top model are considered to have substantial support (Symonds and Moussalli, 2011) and were included in our confidence set of models. The following predictor variables were used for the BKA and mean corticosterone concentration (MCC) model selection: altitude (high or low), sex, mass (g) of animal, and time held. Handling time was included as a covariate in the BKA models, as acute stress from handling may also affect innate immunity (e.g., Matson et al., 2006). Time held was included as a covariate for MCC models, because it has also previously been shown to associate with increased corticosterone levels in wild captured birds (Romero and Reed, 2005), although longer time in traps did not appear to increase stress levels in wild rodents (Fletcher and Boonstra, 2006). We also ran separate BKA model selection to test for an explicit effect of stress on bacteria-killing ability by adding MCC as a covariate to the global model, excluding time held, as the two variables are expected to be correlated. We confirmed that all numeric predictor variables (mass, time held, and MCC) all showed correlation coefficients below 0.3.
We used the “maxsize” parameter to set the maximum number of terms to be included in any model to two, to avoid overfitting. The distribution of our response variables were not normally distributed based on formal tests, however, multiple regression models estimated using ordinary least squares (Gaussian) only require an assumption of normally distributed errors, not normally distributed response variables (Williams et al., 2013). In addition, Gaussian models are fairly robust to non-normality (Knief and Forstmeier, 2018). We verified that residuals are normally distributed and that simulated data from the model matched distributions of observed data.
Gastrointestinal parasite assay
We analyzed 29 fecal samples from 19 animals (10 female, three male, and six unidentified sex; 2017, n = 8; 2018, n = 11). In cases in which the same individual (from the same capture) had more than one fecal sample, we used the mean value.
We calculated prevalence, abundance and intensity for the years (2017 and 2018) and for the altitudes (low and high). Prevalence was calculated as the percentage of infected from sampled individuals; abundance was calculated as the number of eggs/ oocysts per gram of feces for each individual, including zeros; intensity was calculated as the number of eggs/oocysts per gram of feces for infected individuals (not including zeros). We then calculated the confidence interval for the parasite prevalence (traditional Clopper–Pearson CI), confidence interval for the mean intensity (bias-corrected and accelerated (BCa) Bootstrap with 5000 replications) and confidence interval for the mean abundance (Bootstrap BCa with 5000 replications). Fisher's exact test was used to analyze the parasite prevalence data. Since a large number of parasites can be concentrated within very few hosts, bootstrap tests are recommended, as they do not assume a specific distribution of infection among hosts (Rózsa et al., 2000). We used a bootstrap t-test with 5000 replications to compare intensity and abundance by the population, sex and year.
All parasite statistical analyses were conducted using the Quantitative Parasitology Website ( http://www2.univet.hu/qpweb/qp10/index.php). All other statistics were conducted with R 3.5.1.
RESULTS
Bacteria-killing assay
After applying model selection to the full dataset (with both sexes, 15 female, four male), we found that three models were within ΔAICc < 2 ( Supplementary Table S1 (10.2108.zsj.37.31.s1.pdf)). The best model was BKA = intercept + altitude with a weight of 0.585 (Table 2). The other two models in the confidence set included the predictor time held (weight = 0.226) and altitude + time held (weight = 0.121).
Bacteria-killing ability was significantly greater at higher altitude than lower altitude (GLM, low altitude estimate = –27.50 (SE = 9.27), t = –2.97, P = 0.009, Table 2, Fig. 2A). Other predictor variables were not significantly associated with BKA.
Model selection for female samples only (n = 15) identified only one model within ΔAICc < 2 of the best model ( Supplementary Table S2 (10.2108.zsj.37.31.s1.pdf)). The best model for the entire dataset including males was qualitatively the same as for female-only models (BKA = intercept + altitude, weight = 0.579). This model also showed that bacteria-killing ability was significantly greater at higher than lower altitude (GLM, low altitude estimate = –35.30 (SE = 10.63), t = –3.32, P = 0.006, Fig. 2B).
To explicitly test for an effect of stress on bacteria killing ability we added MCC as a covariate to the global model (excluding time held) predicting BKA and ran model selection for the full dataset and for females separately. Model selection for the full dataset (with both sexes, 15 female, four male) identified one model within ΔAICc < 2 of the best model ( Supplementary Table S3 (10.2108.zsj.37.31.s1.pdf)), and the best model was again BKA ∼ 1 + altitude with a weight = 0.512. Model selection for the just female dataset also identified only one model within ΔAICc < 2 of the best model ( Supplementary Table S4 (10.2108.zsj.37.31.s1.pdf)), and the best model was again BKA ∼ 1 + altitude with a weight = 0.634.
Table 2.
Best-fit general linear model coefficients for predictors of bacteria-killing ability (BKA) of Turkish blind mole rats (n = 19).

Fig. 2.
Partial regression plots of the effect of altitude on bacteria killing ability. (A) Bacteria killing ability by altitude for full dataset (n = 19) and (B) for only females (n = 15), from the lowest AICc model, BKA ∼ Intercept + altitude. The negative BKA values stem from a known phenomenon that occurs when the bacteria grows faster in the samples than the controls due to extra nutrients provided by the serum (Tieleman et al., 2005; reviewed in Brooks and Mateo, 2013). Points represent the partial residuals, the black line indicates predicted values from the model, and the grey area indicates 95% CI of the predicted values.

Fig. 3.
Partial regression plots of the effect of altitude on the mean corticosterone concentration (µg/dL) for both sexes (n = 19), from the second best model (MCC ∼ Intercept + altitude). The effect of altitude on MCC is non-significant (P = 0.171). Points represent the partial residuals, the black line indicates predicted values from the model, and the grey area indicates 95% CI of the predicted values.

Stress (corticosterone) assay
Model selection for the full dataset (with both sexes, 15 female, four male) identified four models within ΔAICc < 2 of the best model, and the best model was Mean Corticosterone Concentration (MCC) = Intercept; i.e., it did not include any predictor variables ( Supplementary Table S5 (10.2108.zsj.37.31.s1.pdf)). Univariate models for altitude, sex, and time held were in the confidence set of models (ΔAICc < 2) in that order (weights = 0.191, 0.124, 0.105, respectively, Supplementary Table S5 (10.2108.zsj.37.31.s1.pdf)). However, none of these models were significantly better than the intercept-only model based on overall F-tests (all P > 0.05). The regression plot for MCC by altitude is shown in Fig. 3.
Model selection applied to female samples only (n = 15) identified only one model within ΔAICc < 2 of the best model, and this model was also the intercept-only model with a weight = 0.514 ( Supplementary Table S6 (10.2108.zsj.37.31.s1.pdf)).
Gastrointestinal parasite assay
Fourteen of 19 individuals were found to be infected by gastrointestinal parasites. Morphological measurements were used to identify two major taxonomic groups of gastrointestinal parasites (Table 3): coccidian of genus Eimeria (Protozoa) and a parasitic roundworm most likely belonging to the genus Strongyloides (Nematoda). Coccidia dominated the infections, with a mean intensity score of 56.4 oocytes (Bootstrap BCa CI 25.6 to 116) (Table 3). Since only one individual was found with nematode eggs, we focus below on results from coccidia.
The prevalence of coccidia was high, at least 50% for each year and altitude category, and was not significantly greater at high than at low altitude (87.5% and 63%, respectively; low, n = 11; high, n = 8; Fisher's exact test 2-sided P = 0.338). The prevalence in 2017 samples was greater than in 2018 samples (100% and 54%, respectively; 2017, n = 8; 2018, n = 11; Fisher's exact test 2-sided P = 0.045, Fig. 4A). We found no significant difference in prevalence by sex (70% and 33.3%, respectively; F, n = 10; M, n = 3; Fisher's exact test 2-sided P = 0.511).
Table 3.
Mean parasite prevalence, species richness (by taxonomic group), and parasite intensity for all Turkish blind mole-rats (Nannospalax xanthodon) captured in in 2017 and 2018 (n = 19). (Bootstrap BCa with 5000 replicates).

Table 4.
Parasite (coccidian and nematode) parameters measured separately for each sampling site and year. (Bootstrap BCa with 5000 replicates).

Fig. 4.
Coccidian parasitism measures in Turkish blind mole-rats by year. (A) Prevalence of coccidian is significantly higher in October 2017 than June 2018 (Fisher's exact test 2-sided P = 0.045). Boxes represent the 95% Clopper-Pearson CI and black lines indicate the observed prevalence. (B) Coccidian abundance is also significantly greater in October 2017 than June 2018 (bootstrap t-test with 5000 replications P = 0.045). Dotted vertical lines indicate the mean coccidian abundance per year. 2017 and 2018 year samples sizes are n = 8 and n = 11, respectively.

Coccidian intensity was not significantly different between years and altitudes (Table 4, Supplementary Tables S7 and S8 (10.2108.zsj.37.31.s1.pdf) for results from statistical tests). However, coccidian abundance was significantly greater in 2017 than 2018 (2017, n = 8, mean (SD) = 93.22(95.65); 2018, n = 11, mean (SD) = 3.99(6.08); bootstrap t-test with 5000 replications P = 0.045, Fig. 4B). We could not compare the intensity between the sexes because when we excluded animals with missing values, there was only one male infected. Coccidian abundance was also not significantly different between the sexes (F, n = 10, mean (SD) = 48.33 (91.57); M, n = 3, mean (SD) = 41.74 (72.29); bootstrap t-test with 5000 replications P = 0.901).
DISCUSSION
In this study, we compared the effect of altitude on standing innate immune defense and stress levels, as well as on prevalence, abundance, and intensity of gastrointestinal parasites of TBMR. We found that (i) standing innate immunity is greater in the high altitude mole-rat population than in the low-altitude populations, and (ii) neither stress (as measured by corticosterone concentration) nor (iii) gastro-intestinal parasite measurements differed by altitude.
Having a greater innate immune response at the high altitude can be explained by the high cost of infection on survival at higher altitudes. Simple infections may cause more serious damage in harsher mountain conditions, leading to stronger selection pressure for pathogen resistance. Thus, high-altitude populations may need to make a greater investment into innate standing immune defense. Altitude effects on immunity have been of interest for over 60 years (reviewed in Richard and Meehan, 1987; Eisen et al., 2013). However, previous studies have almost exclusively focused on humans and laboratory animals, and on changes in immune function of subjects exposed to high altitude, not adapted to high altitude. The present study makes an important contribution to the fields of alpine ecology and ecoimmunology by investigating potential immune adaptations to altitude in wild populations. Being able to predict environmental correlates of immune response will be important to mitigate effects of ongoing climate-mediated shifts in pathogen ranges (Altizer et al., 2013).
Immune responses can differ by sex (Klein and Flanagan, 2016; Jaillon et al., 2017; but see Kelley et al., 2018 for a recent meta-analysis). In our dataset, the sexes were unequally represented (F = 15, M = 4). This is simply due to the fact that collecting live female TMBRs is much easier in the field than collecting males (see Sözen, 2005 for an example of high female to male ratio in a large sample). This prevented us from testing for an effect of sex independent of altitude on the innate immune response in Turkish blind mole-rats. However, we were able to show that bacteria-killing ability is significantly higher at higher altitude, both for the entire dataset (Fig. 2A) and when only females are considered (Fig. 2B). Therefore, our main result appears robust despite the possibility of an effect of sex on immune response. While we acknowledge that our sample size is small, the use of approximately eight replicates per category is common for immunological studies using non-model organisms (Gardner et al., 2018, cane toad, n = 9 per group, total 27; Gao and Deviche, 2018, house sparrow, n = 10 per group, total 20; Georgiev et al., 2015, rhesus macaques, n = 10–15 per immunological test; Matson et al., 2012, homing pigeons, n = 8 per group, total 16; Moeller et al., 2017, Gila monster, n = 3 females, 5 males, 8 total; Neuman-Lee et al., 2019, common gartersnake, n = 22).
Stress has previously been shown to augment immune activity (reviewed by Martin, 2009), so in the present study we sought to control for its potential confounding effect. According to the assay protocol we used, all animals were in the natural range of corticosterone concentration (1.68–21.95 µg/dL, Fig. 3). We found no significant effect of altitude, mass, sex, or time held in captivity on mean corticosterone concentration. MCC was positively correlated with time held, though not significantly so (Spearman's rho = 0.208, P = 0.393, n = 19). It is thus not surprising that including MCC as a potential covariate in BKA model selection did not influence the confidence set of models. One explanation for the lack of relationship between corticosterone concentration and BKA and time held is that mole-rats may simply produce low levels of glucocorticoid after acute stress. There is evidence that fossorial rodents, living in relatively stable microclimatic conditions, are adapted to environments with fewer extreme external stressors and are thus less reactive to stress (Moshkin et al., 2002).
Increasing altitude is generally known to decrease abundance, mortality and transmission of pathogens (LaPointe et al., 2010; Zanet et al., 2017; van Riper et al., 1986; Michel et al., 2014). While some studies have found positive correlations between pathogen (Yersinia pestsis and viruses) prevalence in rodent hosts and altitude (Tadin et al., 2014; Tollenaere et al., 2010; Tollenaere et al., 2008; Tollenaere et al., 2011), other studies have reported no correlation between altitude and ectoparasite (flea) abundance, but found positive correlations between the diversity of ectoparasites and altitude (Moore et al., 2015). In the present study, we also found no relationship between gastrointestinal parasite prevalence, abundance and intensity, and altitude. This may be due in part to the fact that fecal examinations have significantly lower ability to detect gastrointestinal parasites compared to direct intestine examination, or to PCR-based screening methods. In addition, the localization of parasites in host organs and the randomness of the presence of parasites in feces are important factors that we were unable to address (Jorge et al., 2013).
Our initial hypothesis was based on assumptions that parasite abundance is higher in lower-altitude environments, and that investment into immune defense correlates positively with the risk of infection. Thus, we expected to see greater standing innate immunity in the low-altitude populations. However, the results of the bacteria-killing assay showed that, contrary to our expectations, high-altitude animals showed greater standing innate immunity, presumably because there is higher cost of repeated or sustained infection at high altitude. This may be mediated by relatively greater energy costs from repeated or prolonged immune activation at high altitudes, as basal metabolic rate and energy expenditure can increase between 17–27% at high altitude (4300 m, Butterfield et al., 1992). In addition to increasing metabolic rate, high-altitude environments are generally colder than low-altitude environments, and have lower available oxygen, which contributes to greater thermoregulatory demands and lower capacity for sustained thermogenesis. Just as these factors can select for increased thermogenic capacity at high altitude (∼3800 m) in deer mice (Hayes and O'Connor, 1999), they could also select for increased immune system efficacy. Another point to consider is that adaptations to tolerate hypoxic stress underground are shared among subterranean rodents (Lewis et al., 2016). Therefore, differences in oxygen availability between the altitudes we sampled may be physiologically equivalent to those of mole-rats adapted to hypoxic conditions. In other words, reduced oxygen, a key altitudinal stressor, may not be much of a stressor in the present study system.
The immune defense component model (Schmid-Hempel and Ebert, 2003) separates the immune system by two intersecting axes: one a continuum of specific to nonspecific defense, the other a continuum of constantly maintained (constitutive) defenses to (induced) defenses deployed in response to activation. In the present study, we focused only on constitutive innate immunity. However, because of the complexity of the immune system, it is suggested that multiple immune indices should be measured to more fully understand which components contribute most strongly to an organism's immune response (Sheldon and Verhulst, 1996; Schmid-Hempel and Ebert, 2003; Lee, 2006; Martin et al., 2008; Demas et al., 2011).
To better understand the complex relationship between altitude and the immune system, we provide some general recommendations for future research. Sampling across altitudinal gradients rather than binary low- and high-altitude categories, and sampling multiple species, will provide more power for testing immune system adaptations to altitude (e.g., Sun et al., 2018, for identifying genetic adaptations to high altitude). In addition, recording climatic conditions (e.g., temperature, humidity) may be helpful for teasing apart mechanisms. Surveying multiple types of parasites, such as ectoparasites, blood protozoa, and viruses, could reveal stronger links between parasitism and altitude. Common garden experiments, where animals adapted to higher and lower altitude environments are brought to the laboratory for concurrent study, will be important to confirm that differences in immune response traits are genetically-based instead of environmentally-dependent. In addition, we stress the need to measure multiple measures of immune function, or even whole organism traits, such as host competence, tolerance, or resistance (e.g., Martin et al., 2016; Burgan et al., 2019), which can be accomplished in the field by measuring fitness indices before and after parasite removal and immune challenge experiments. Finally, it is important to validate assays for non-model study systems being investigated.
ACKNOWLEDGMENTS
We are grateful to Prof. Mayda Gürsel and Dr. İshak Özel Tekin for advice on immune system research, to Alara Turgut for help quantifying gastrointestinal parasites, to Calin Gherman for parasite identification, and to Serkan Gülsoy for supplying climate data. We also appreciate the constructive feedback of two anonymous reviewers. The fieldwork was funded by the TÜBITAK project 117Z596. JCW was supported by the TÜBITAK program 2221 and by the German Research Foundation (DFG) as part of the SFB TRR 212 (316099922).
AUTHOR CONTRIBUTIONS
JCW designed the study and JCW, AY and MS initiated the study; FÇ, FM, AY and HMS collected field samples; HMS and İCA performed lab assays; JCW and HMS analyzed data; HMS, JCW and AY wrote the manuscript and all authors contributed substantial input to the final version of the manuscript.
DATA ACCESSIBILITY
The data for our analyses and R code are deposited on figshare (doi: 10.6084/m9.figshare.9734918).
SUPPLEMENTARY MATERIALS
Supplementary materials (10.2108.zsj.37.31.s1.pdf) for this article are available online. (URL: https://bioone.org/journals/supplementalcontent/10.2108//zs190067/10.2108.zsj.37.31.s1.pdf)
Supplementary Figure S1 (10.2108.zsj.37.31.s1.pdf). Bacterial growth for all absorbance filters by time (hours).
Supplementary Figure S2 (10.2108.zsj.37.31.s1.pdf). Bacteria-killing ability by serum dilutions for 340 nm.
Supplementary Table S1 (10.2108.zsj.37.31.s1.pdf). Top set of generalized linear models for bacteria killing ability (BKA).
Supplementary Table S2 (10.2108.zsj.37.31.s1.pdf). Top set of generalized linear models for bacteria killing ability (BKA).
Supplementary Table S3 (10.2108.zsj.37.31.s1.pdf). Top set of general linear models for bacteria killing ability (BKA) with MCC variable as a covariate.
Supplementary Table S4 (10.2108.zsj.37.31.s1.pdf). Top set of general linear models for bacteria killing ability (BKA) with MCC variable.
Supplementary Table S5 (10.2108.zsj.37.31.s1.pdf). Top set of general linear models for mean corticosterone concentrations (MCC).
Supplementary Table S6 (10.2108.zsj.37.31.s1.pdf). Top set of general linear models for mean corticosterone concentrations (MCC).
Supplementary Table S7 (10.2108.zsj.37.31.s1.pdf). Comparisons of coccidian parasitism measures in Turkish blind mole-rats by year.
Supplementary Table S8 (10.2108.zsj.37.31.s1.pdf). Comparisons of coccidian parasitism measures in Turkish blind mole-rats by altitude.